

Medicine - Vaccination > 1905-1912 - Vaccination returns of the Province of Eastern Bengal and Assam > Vaccination returns of the Province of Eastern Bengal and Assam for the season 1906-1907
(64) Page 6
Download files
Individual page:
Thumbnail gallery: Grid view | List view
6
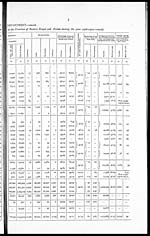
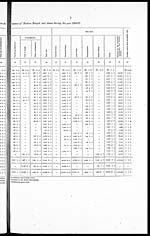
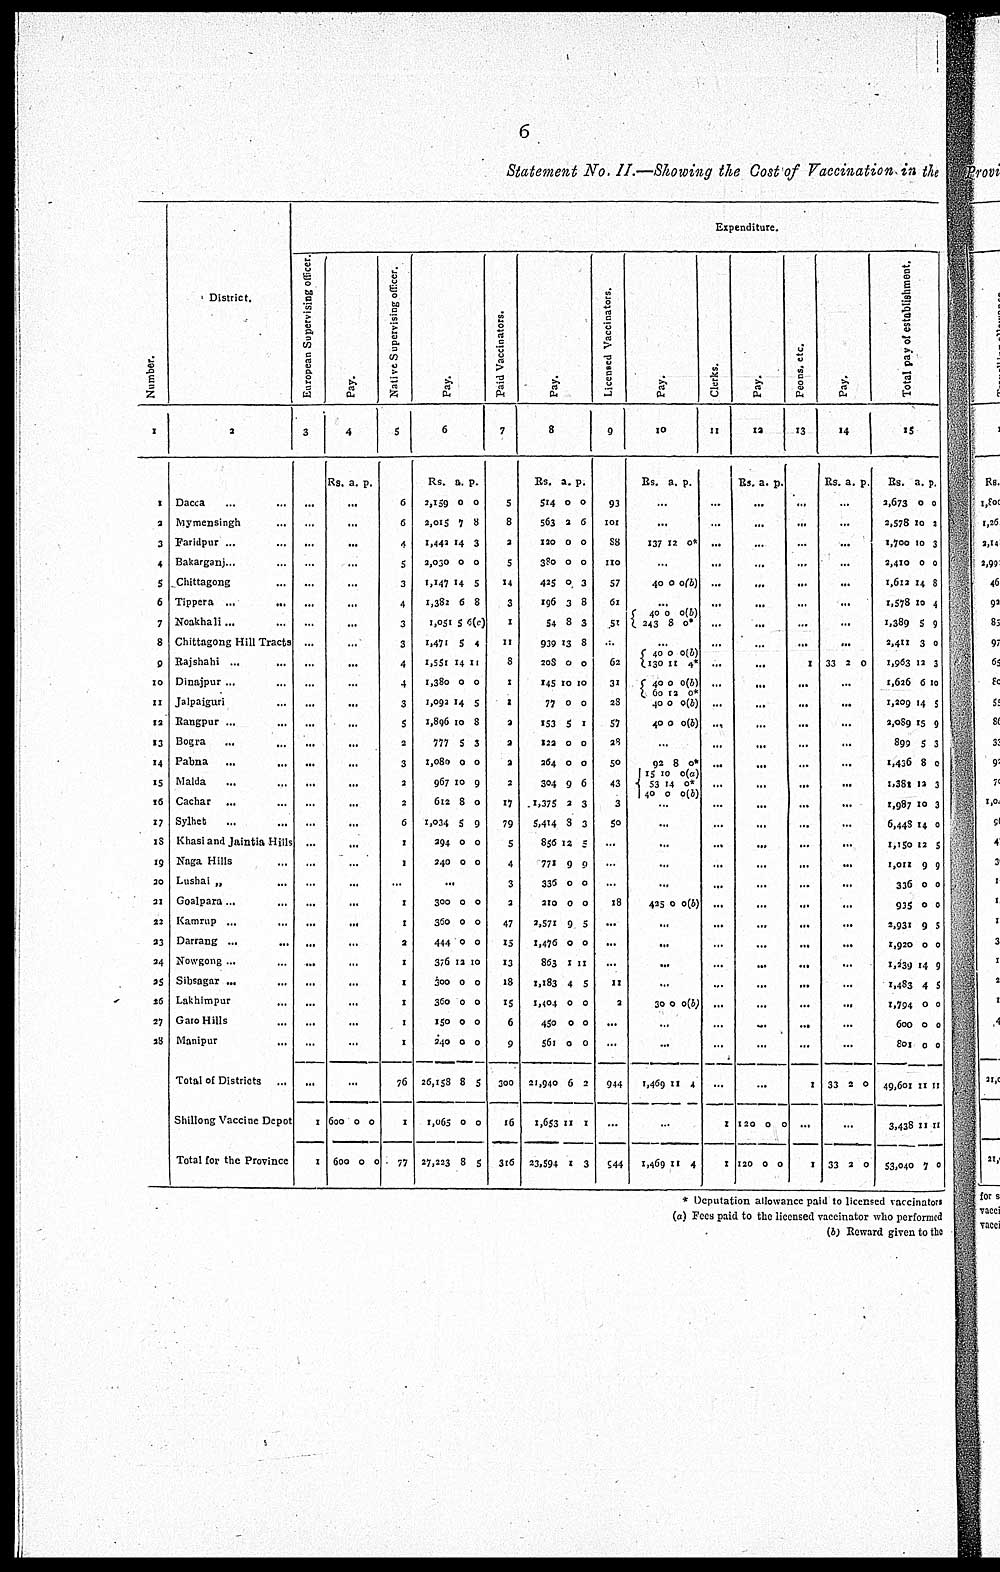
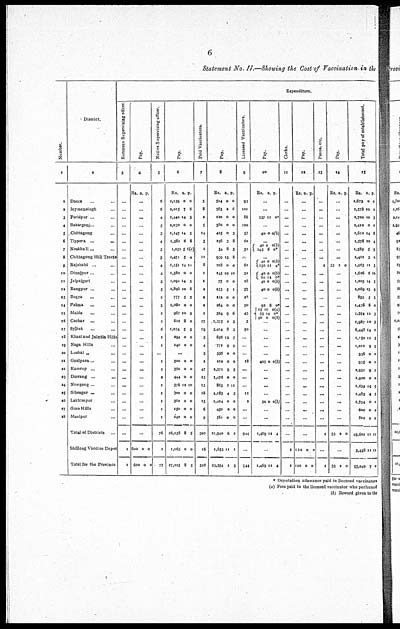
Statement No. II.—Showing the Cost of Vaccination in the
|
Number. |
District. |
Expenditure. |
||||||||||||||||||||||||||
|
European Supervising officer. |
Pay. |
Native Supervising officer. |
Pay. |
Paid Vaccinators. |
Pay. |
Licensed Vaccinators. |
Pay. |
Clerks. |
Pay. |
Peons, etc. |
Pay. |
Total pay of establishment. |
||||||||||||||||
|
1 |
2 |
3 |
4 |
5 |
6 |
7 |
8 |
9 |
10 |
11 |
12 |
13 |
14 |
15 |
||||||||||||||
|
Rs. |
a. |
p. |
Rs. |
a. |
p. |
Rs. |
a. |
p. |
Rs. |
a. |
p. |
Rs. |
a. |
p. |
Rs. |
a. |
p. |
Rs. |
a. |
p. |
||||||||
|
1 |
Dacca... ... |
... |
... |
6 |
2,159 |
0 |
0 |
5 |
514 |
0 |
0 |
93 |
... |
... |
... |
... |
... |
2,673 |
0 |
0 |
||||||||
|
2 |
Mymensingh... ... |
... |
... |
6 |
2,015 |
7 |
8 |
8 |
563 |
2 |
6 |
101 |
... |
... |
... |
... |
... |
2,578 |
10 |
2 |
||||||||
|
3 |
Faridpur... ... |
... |
... |
4 |
1,442 |
14 |
3 |
... |
120 |
0 |
0 |
88 |
137 |
12 |
0* |
... |
... |
... |
... |
1,700 |
10 |
3 |
||||||
|
4 |
Bakarganj... ... |
... |
... |
5 |
2,030 |
0 |
0 |
... |
380 |
0 |
0 |
110 |
... |
... |
... |
... |
... |
2,410 |
0 |
0 |
||||||||
|
5 |
Chittagong... ... |
... |
... |
3 |
1,147 |
14 |
5 |
14 |
425 |
0 |
3 |
57 |
40 |
0 |
o(b) |
... |
... |
... |
... |
1,612 |
14 |
8 |
||||||
|
6 |
Tippera... ... |
... |
... |
4 |
1,382 |
6 |
8 |
... |
196 |
3 |
8 |
61 |
... |
... |
... |
... |
... |
1,578 |
10 |
4 |
||||||||
|
7 |
Noakhali... ... ... |
... |
... |
3 |
1,051 |
5 |
5(c) |
1 |
54 |
8 |
3 |
51 |
40 |
0 |
0(b) |
... |
... |
... |
... |
1,389 |
5 |
9 |
||||||
|
243 |
8 |
0* |
||||||||||||||||||||||||||
|
8 |
Chittagong Hill Tracts |
... |
... |
3 |
1,471 |
5 |
4 |
11 |
939 |
13 |
8 |
... |
... |
... |
... |
... |
... |
2,411 |
3 |
0 |
||||||||
|
40 |
0 |
0(b) |
||||||||||||||||||||||||||
|
9 |
Rajshahi... ... |
... |
... |
4 |
1,551 |
14 |
11 |
8 |
208 |
0 |
0 |
62 |
l30 |
11 |
4* |
... |
... |
1 |
33 |
2 |
0 |
1,963 |
12 |
3 |
||||
|
10 |
Dinajpur ... |
... |
... |
4 |
1,380 |
0 |
0 |
1 |
145 |
10 |
10 |
31 |
40 |
0 |
0(b) |
... |
... |
... |
... |
1,626 |
6 |
10 |
||||||
|
60 |
12 |
0* |
||||||||||||||||||||||||||
|
11 |
Jalpaiguri... ... ... |
... |
... |
3 |
1,092 |
14 |
5 |
1 |
77 |
0 |
0 |
28 |
40 |
0 |
0(b) |
... |
... |
... |
... |
1,209 |
14 |
5 |
||||||
|
12 |
Bangpur... ... |
... |
... |
5 |
1,896 |
10 |
8 |
2 |
153 |
5 |
1 |
57 |
40 |
0 |
0(b) |
... |
... |
... |
... |
2,089 |
15 |
9 |
||||||
|
13 |
Bogra... ... |
... |
... |
2 |
777 |
5 |
3 |
2 |
122 |
0 |
0 |
23 |
... |
... |
... |
... |
... |
899 |
5 |
3 |
||||||||
|
14 |
Pabna... ... ... |
... |
... |
3 |
1,080 |
0 |
0 |
2 |
264 |
0 |
0 |
50 |
92 |
8 |
0* |
... |
... |
... |
... |
1,436 |
8 |
0 |
||||||
|
15 |
Malda... ... ... |
... |
... |
3 |
967 |
10 |
9 |
2 |
304 |
9 |
6 |
43 |
151 |
0 |
0(a) |
... |
... |
... |
... |
1,381 |
12 |
3 |
||||||
|
53 |
14 |
0* |
||||||||||||||||||||||||||
|
16 |
Cachar... ... ... |
... |
... |
2 |
612 |
8 |
0 |
17 |
1,375 |
2 |
3 |
3 |
40 |
0 |
0(b) |
... |
... |
... |
... |
1,987 |
10 |
3 |
||||||
|
... |
||||||||||||||||||||||||||||
|
17 |
Sylhet... ... ... |
... |
... |
6 |
1,034 |
5 |
9 |
79 |
5,414 |
3 |
3 |
50 |
... |
... |
... |
... |
... |
6,448 |
14 |
0 |
||||||||
|
18 |
Khasi and Jalntia Hills |
... |
... |
1 |
294 |
0 |
0 |
5 |
856 |
12 |
5 |
... |
... |
... |
... |
... |
... |
1,150 |
12 |
5 |
||||||||
|
19 |
Naga Hills... |
... |
... |
1 |
240 |
0 |
0 |
4 |
771 |
9 |
9 |
... |
... |
... |
... |
... |
... |
1,011 |
9 |
9 |
||||||||
|
20 |
Lushai „ ... |
... |
... |
... |
... |
3 |
336 |
0 |
0 |
... |
... |
... |
... |
... |
... |
336 |
0 |
0 |
||||||||||
|
21 |
Goalpara... ... |
... |
... |
1 |
300 |
0 |
0 |
2 |
210 |
0 |
0 |
18 |
425 |
0 |
0(b) |
... |
... |
... |
... |
935 |
0 |
0 |
||||||
|
22 |
Kamrup... ... ... |
... |
... |
1 |
360 |
0 |
0 |
47 |
2,571 |
9 |
5 |
... |
... |
... |
... |
... |
... |
2,931 |
9 |
5 |
||||||||
|
23 |
Darrang... ... |
... |
... |
2 |
444 |
0 |
0 |
15 |
1,476 |
0 |
0 |
... |
... |
... |
... |
... |
... |
1,920 |
0 |
0 |
||||||||
|
24 |
Nowgong... ... |
... |
... |
1 |
376 |
12 |
10 |
13 |
863 |
1 |
11 |
... |
... |
... |
... |
... |
... |
1,239 |
14 |
9 |
||||||||
|
25 |
Sibsagar... ... |
... |
... |
1 |
300 |
0 |
0 |
18 |
1,183 |
4 |
5 |
11 |
... |
... |
... |
... |
... |
1,483 |
4 |
5 |
||||||||
|
26 |
Lakhimpur... |
... |
... |
1 |
360 |
0 |
0 |
15 |
1,404 |
0 |
0 |
2 |
30 |
0 |
0(b) |
... |
... |
... |
... |
1,794 |
0 |
0 |
||||||
|
27 |
Garo Hills... ... |
... |
... |
1 |
150 |
0 |
0 |
6 |
450 |
0 |
0 |
... |
... |
... |
... |
... |
... |
600 |
0 |
0 |
||||||||
|
28 |
Manipur... ... |
... |
... |
1 |
240 |
0 |
0 |
9 |
561 |
0 |
0 |
... |
... |
... |
... |
... |
... |
801 |
0 |
0 |
||||||||
|
Total of Districts... ... |
... |
... |
76 |
26,158 |
8 |
5 |
300 |
21,940 |
6 |
2 |
944 |
1,469 |
11 |
4 |
... |
... |
1 |
33 |
2 |
0 |
49,601 |
11 |
11 |
|||||
|
Shillong Vaccine Depot |
1 |
600 |
0 |
0 |
1 |
1,065 |
0 |
0 |
16 |
1,653 |
11 |
1 |
... |
... |
1 |
120 |
0 |
0 |
... |
... |
3,438 |
11 |
11 |
|||||
|
Total for the Province |
1 |
600 |
0 |
0 |
77 |
27,223 |
8 |
5 |
316 |
23,594 |
1 |
3 |
944 |
1,469 |
11 |
4 |
1 |
120 |
0 |
0 |
1 |
33 |
2 |
0 |
53,040 |
7 |
0 |
|
* Deputation allowance paid to licensed vaccinators
(a) Fees paid to the licensed vaccinator who performed
(b) Reward given to the
Set display mode to: Large image | Zoom image | Transcription
Images and transcriptions on this page, including medium image downloads, may be used under the Creative Commons Attribution 4.0 International Licence unless otherwise stated. ![]()
| Permanent URL | https://digital.nls.uk/91528521 |
|---|
| Additional NLS resources: | |
|---|---|
| Description | Covers 1905-1912. Details and appraises vaccination operations in Eastern Bengal and Assam. Describes manufacture and storage of lymph. Tables show particulars of vaccination. Success and mortality rates noted. Foldout and colour diagrams included. |
|---|---|
| Shelfmark | IP/7/VA.3 |
| Attribution and copyright: |
|
| Description | The Vaccination collection consists of 66 volumes dating from 1856 to 1933. Reports show how vaccination against smallpox was implemented in India. They reveal the shift from variolation, improved vaccination techniques, logistics of lymph supply, funding and staffing. They explore how the local population viewed and resisted western vaccination. |
|---|---|
| Description | The India Papers collection contains publications of the central (Imperial) Government and many Indian states. Most states came under British rule. Much of the collection dates from between the post-Mutiny re-organisation of the Indian Government and Indian Independence in 1947. Some items published in London by John Murray. |
|---|---|
| Shelfmark | India Papers |
| Additional NLS resources: | |