Medicine - Vaccination > 1874-1927 - Annual vaccination report of the province of Assam > Vaccination report Assam 1896-1927 > 1924-1925 - Annual vaccination returns of the Province of Assam for 1924-25
(622) Page 14
Download files
Individual page:
Thumbnail gallery: Grid view | List view

14
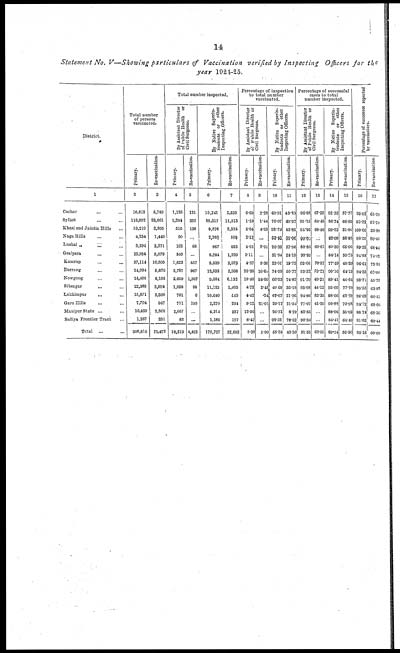
Statement No. V—Showing particulars of Vaccination verified by Inspecting Officers for the
year 1924-25.
|
District. |
Total number |
Total number inspected. |
Percentage of inspection |
Percentage of successful |
Percentage of successes reported |
|||||||||||
|
By Assistant Director |
By Native Superin- |
By Assistant Director |
By Native Superin- |
By Assistant Director |
By Native Superin- |
|||||||||||
|
Primary. |
Re-vaccination. |
Primary. |
Re-vaccination. |
Primary. |
Re-vaccination. |
Primary. |
Re-vaccination. |
Primary. |
Re-vaccination. |
Primary. |
Re-vaccination |
Primary. |
Re-vaccination. |
Primary. |
Re-vaccination |
|
|
1 |
2 |
3 |
4 |
5 |
6 |
7 |
8 |
9 |
10 |
11 |
12 |
13 |
14 |
15 |
16 |
17 |
|
Cachar ... ... |
16,812 |
5,749 |
1,125 |
131 |
10,241 |
2,520 |
6.69 |
2.28 |
60.91 |
43.83 |
96.88 |
67.93 |
92.32 |
57.77 |
95.03 |
65.29 |
|
Sylhet ... ... |
116,092 |
23,061 |
1,384 |
332 |
88,317 |
11,513 |
1.19 |
1.44 |
76.07 |
49.92 |
95.15 |
64.45 |
86.74 |
66.02 |
95.32 |
52.70 |
|
Khasi and Jaintia Hills ... |
10,210 |
2,805 |
515 |
130 |
9,576 |
2,324 |
5.04 |
4.63 |
93.79 |
82.85 |
94.95 |
68.46 |
99.23 |
31.06 |
100.00 |
33.88 |
|
Naga Hills ... ... |
4,234 |
1,449 |
90 |
... |
2,263 |
508 |
2.12 |
... |
53.45 |
35.06 |
90.00 |
... |
92.09 |
58.85 |
96.50 |
80.46 |
|
Lushai „ ... ... |
3,294 |
2,271 |
162 |
66 |
867 |
653 |
4.91 |
2.91 |
26.32 |
37.56 |
80.86 |
60.61 |
80.39 |
65.06 |
89.59 |
68.54 |
|
Goalpara ... ... |
25,934 |
5,079 |
649 |
... |
8,284 |
1,229 |
2.11 |
... |
31.04 |
24.19 |
99.95 |
.. |
84.14 |
50.75 |
94.88 |
74.02 |
|
Kamrap ... ... |
37,114 |
10,505 |
1,623 |
557 |
8,539 |
2,073 |
4.37 |
5.30 |
23.01 |
19.73 |
93.06 |
70.97 |
77.49 |
40.29 |
96.61 |
73.83 |
|
Darrang ... ... |
14,034 |
5,826 |
3,787 |
967 |
12,532 |
2,958 |
25.36 |
16.60 |
74.00 |
50.77 |
93.32 |
79.21 |
90.16 |
64.13 |
94.35 |
63.66 |
|
Nowgong ... ... |
14,406 |
8,195 |
2,659 |
1,967 |
9,584 |
6,132 |
18.46 |
24.00 |
66.53 |
74.82 |
91.70 |
49.21 |
89.41 |
44.64 |
93.71 |
55.22 |
|
Sibsagar ... ... |
22,388 |
3,994 |
1,058 |
98 |
11,125 |
1,405 |
4.72 |
2.45 |
49.69 |
85.18 |
95.08 |
41.12 |
95.09 |
77.79 |
95.55 |
63.82 |
|
Lakhimpur ... ... |
15,871 |
2,500 |
701 |
6 |
10,640 |
549 |
4.42 |
.24 |
67.67 |
21.96 |
94.86 |
83.33 |
98.06 |
62.29 |
96.68 |
66.41 |
|
Garo Hills ... ... |
7,794 |
947 |
711 |
199 |
2,270 |
204 |
9.12 |
21.01 |
29.12 |
21.54 |
77.07 |
41.20 |
90.83 |
70.98 |
94.72 |
68.66 |
|
Manipur State ... |
10,460 |
2,860 |
2,067 |
... |
4,314 |
237 |
12.56 |
... |
26.21 |
8.29 |
82.55 |
... |
88.96 |
35.02 |
88.74 |
68.36 |
|
Sadiya Frontier Tract ... |
1,267 |
231 |
82 |
... |
1,185 |
177 |
6.47 |
... |
93.52 |
76.62 |
96.34 |
... |
84.41 |
64.10 |
91.63 |
60.41 |
|
Total ... |
306,810 |
75,472 |
16,513 |
4,453 |
179,737 |
32,682 |
5.38 |
5.90 |
58.58 |
43.30 |
91.55 |
62.95 |
89.24 |
56.36 |
95.18 |
60.69 |
Set display mode to: Large image | Zoom image | Transcription
Images and transcriptions on this page, including medium image downloads, may be used under the Creative Commons Attribution 4.0 International Licence unless otherwise stated. ![]()
| Permanent URL | https://digital.nls.uk/91528125 |
|---|
| Additional NLS resources: | |
|---|---|
| Attribution and copyright: |
|
|---|


