Medicine - Vaccination > 1874-1927 - Annual vaccination report of the province of Assam > Vaccination report Assam 1896-1927 > 1917-1918 - Annual vaccination returns of the Province of Assam for the year 1917-18
(450) Page 14
Download files
Individual page:
Thumbnail gallery: Grid view | List view

14
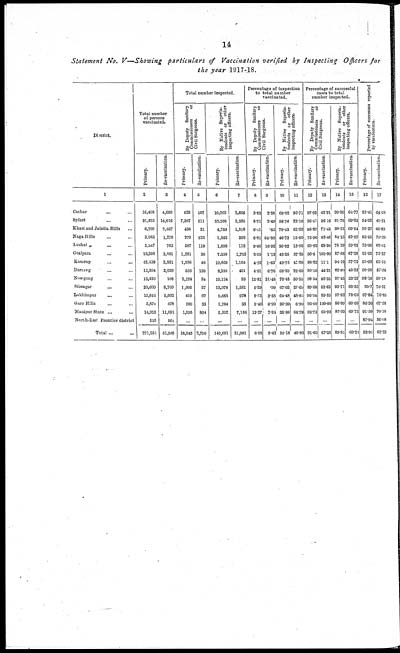
Statement No. V—Showing particulars of Vaccination verified by Inspecting Officers for
the year 1917-18.
|
District. |
Total number |
Total number inspected. |
Percentage of inspection |
Percentage of successful |
Percentage of successes reported |
|||||||||||
|
By Deputy Sanitary |
By Native Superin- |
By Deputy Sanitary |
By Native Superin- |
By Deputy Sanitary |
By Native Superin- |
|||||||||||
|
Primary. |
Re-vaccination. |
Primary. |
Re-vaccination. |
Primary. |
Re-vaccination. |
Primary. |
Re-vaccination. |
Primary. |
Re-vaccination. |
Primary. |
Re-vaccination. |
Primary. |
Re-vaccination. |
Primary. |
Re-vaccination. |
|
|
1 |
2 |
3 |
4 |
5 |
6 |
7 |
8 |
9 |
10 |
11 |
12 |
13 |
14 |
15 |
16 |
17 |
|
Cachar ... ... |
16,458 |
4,699 |
628 |
107 |
10,702 |
2,665 |
3.82 |
2.28 |
65.02 |
56.71 |
97.93 |
43.91 |
90.50 |
64.77 |
91.41 |
64.68 |
|
Sylhet ... ... |
91,423 |
14,616 |
7,507 |
511 |
53,708 |
3,385 |
8.21 |
3.49 |
58.74 |
23.16 |
96.47 |
56.16 |
91.78 |
69.83 |
94.62 |
49.21 |
|
Khasi and Jaintia Hills ... |
6,799 |
2,467 |
436 |
21 |
4,789 |
1,518 |
6.4l |
.85 |
70.43 |
61.53 |
95.87 |
71.43 |
98.12 |
60.54 |
99.27 |
46.69 |
|
Naga Hills ... ... |
3,963 |
1,270 |
270 |
823 |
1,852 |
202 |
6.81 |
64.80 |
46.73 |
15.90 |
72.96 |
83.46 |
84.13 |
52.97 |
93.55 |
79.39 |
|
Lushai „ ... ... |
5,247 |
703 |
507 |
119 |
1,890 |
112 |
9.66 |
16.92 |
36.02 |
15.93 |
69.82 |
68.90 |
75.19 |
59.82 |
75.06 |
63.61 |
|
Goalpara ... ... |
19,208 |
3,081 |
1,281 |
36 |
7,558 |
1,763 |
2.55 |
1.13 |
43.35 |
57.25 |
96.6 |
100.00 |
87.88 |
67.38 |
91.63 |
72.27 |
|
Kamrup ... ... |
45,438 |
2,821 |
1,936 |
46 |
19,869 |
1,164 |
4.26 |
1.63 |
43.72 |
41.26 |
98.82 |
11.1 |
94.19 |
57.72 |
95.03 |
65.54 |
|
Darrang ... ... |
12,304 |
2,039 |
556 |
138 |
8,392 |
461 |
4.51 |
6.76 |
68.20 |
22.60 |
90.10 |
44.21 |
82.80 |
45.33 |
90.50 |
57.56 |
|
Nowgong ... ... |
13,430 |
108 |
2,124 |
34 |
10,134 |
33 |
15.81 |
31.48 |
75.45 |
30.55 |
98.54 |
82.35 |
97.43 |
33.33 |
98.18 |
56.18 |
|
Sibsagar ... ... |
20,669 |
5,709 |
1,095 |
57 |
13,978 |
1,581 |
5.29 |
.99 |
67.62 |
27.69 |
89.68 |
52.63 |
93.71 |
62.55 |
95.7 |
76.51 |
|
Lakhimpur ... ... |
15,016 |
2,002 |
410 |
67 |
9,683 |
978 |
2.73 |
3.35 |
64.48 |
48.83 |
96.34 |
89.55 |
97.82 |
78.62 |
97.04 |
76.83 |
|
Garo Hills ... ... |
5,870 |
478 |
200 |
33 |
1,784 |
33 |
3.40 |
6.90 |
30.39 |
6.90 |
96.00 |
100.00 |
86.09 |
60.66 |
86.36 |
67.26 |
|
Manipur State ... ... |
14,913 |
11,091 |
1,995 |
804 |
5,352 |
7,186 |
13.37 |
7.24 |
35.88 |
64.79 |
93.73 |
65.92 |
87.93 |
69.72 |
91.50 |
70.10 |
|
North-East Frontier district |
513 |
501 |
... |
... |
... |
... |
... |
... |
... |
... |
... |
... |
... |
... |
87.94 |
58.68 |
|
Total ... ... |
271,251 |
51,585 |
18,945 |
2,796 |
149,691 |
21,081 |
6.98 |
5.42 |
55.18 |
40.86 |
91.60 |
67.28 |
89.81 |
60.21 |
93.91 |
62.29 |
Set display mode to: Large image | Zoom image | Transcription
Images and transcriptions on this page, including medium image downloads, may be used under the Creative Commons Attribution 4.0 International Licence unless otherwise stated. ![]()
| Permanent URL | https://digital.nls.uk/91527585 |
|---|
| Additional NLS resources: | |
|---|---|
| Attribution and copyright: |
|
|---|


