Medicine - Vaccination > 1874-1927 - Annual vaccination report of the province of Assam > Vaccination report Assam 1874-1896 > 1891-1892 - Annual vaccination report of the Province of Assam for the year 1891-92
(396) Page 20
Download files
Individual page:
Thumbnail gallery: Grid view | List view

20
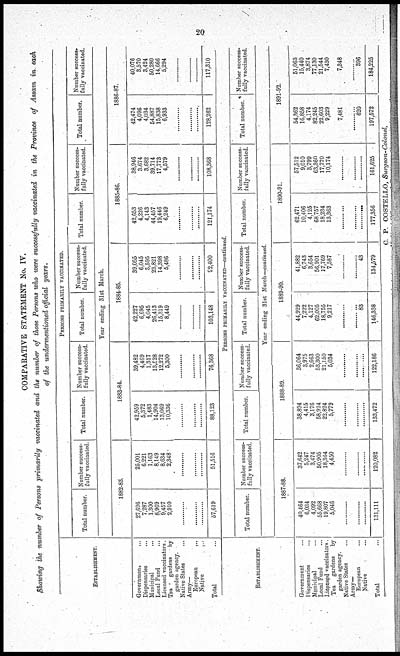
COMPARATIVE STATEMENT No. IV.
Showing the number of Persons primarily vaccinated and the number of those Persons who were successfully vaccinated in the Province of Assam in each
of the undermentioned official years.
|
ESTABLISHMENT. |
PERSONS PRIMARILY VACCINATED. |
|||||||||
|
Total number. |
Number success- |
Total number. |
Number success- |
Total number. |
Number success- |
Total number. |
Number success- |
Total number. |
Number success- |
|
|
Year ending 31st March. |
||||||||||
|
1882-83. |
1883-84. |
1884-85. |
1885-86. |
1886-87. |
||||||
|
Government ... |
27,696 |
25,001 |
42,959 |
39,482 |
42,227 |
39,055 |
42,653 |
38,946 |
42,474 |
40,076 |
|
Dispensaries ... |
7,287 |
6,221 |
5,372 |
4,469 |
6,695 |
6,045 |
4,226 |
3,674 |
4,096 |
3,570 |
|
Municipal ... |
1,300 |
1,163 |
1,483 |
1,317 |
4,045 |
3,595 |
4,143 |
3,682 |
4,034 |
3,424 |
|
Local Fund ... |
8,969 |
8,149 |
14,904 |
13,528 |
26,413 |
23,821 |
44,457 |
39,714 |
54,887 |
50,280 |
|
Licensed vaccinators. |
9,457 |
8,634 |
13,069 |
12,272 |
15,319 |
14,398 |
19,446 |
17,773 |
15,838 |
14,666 |
|
Tea gardens by |
2,910 |
2,348 |
10,336 |
5,300 |
8,449 |
5,486 |
6,249 |
4,579 |
6,933 |
5,294 |
|
Native States ... |
...... |
...... |
...... |
...... |
...... |
...... |
...... |
...... |
...... |
...... |
|
Army— |
||||||||||
|
European ... |
...... |
...... |
...... |
...... |
...... |
...... |
...... |
...... |
...... |
...... |
|
Native ... |
...... |
...... |
...... |
...... |
...... |
...... |
...... |
...... |
...... |
...... |
|
Total ... |
57,619 |
51,516 |
88,123 |
76,368 |
103,148 |
92,400 |
121,174 |
108,368 |
128,262 |
117,310 |
|
ESTABLISHMENT. |
PERSONS PRIMARILY VACCINATED—continued. |
|||||||||
|
Total number. |
Number success- |
Total number. |
Number success- |
Total number. |
Number success- |
Total number. |
Number success- |
Total number. |
Number success- |
|
|
Year ending 31st March—continued. |
||||||||||
|
1887-88. |
1888-89. |
1889-90. |
1890-91. |
1891-92. |
||||||
|
Government ... |
40,464 |
37,642 |
38,894 |
36,064 |
44,929 |
41,882 |
62,471 |
57,512 |
54,362 |
51,063 |
|
Dispensaries ... |
6,034 |
5,247 |
4,415 |
3,975 |
7,222 |
6,743 |
10,406 |
9,010 |
16,858 |
15,440 |
|
Municipal ... |
4,092 |
3,474 |
3,176 |
2,663 |
4,127 |
3,654 |
4,125 |
3,799 |
4,174 |
3,874 |
|
Local Fund ... |
55,668 |
50,905 |
58,924 |
53,300 |
62,005 |
56,901 |
68,757 |
63,360 |
82,245 |
77,130 |
|
Licensed vaccinators. |
19,807 |
18,364 |
22,824 |
21,150 |
18,755 |
17,769 |
18,234 |
17,770 |
22,603 |
21,544 |
|
Tea gardens by |
5,046 |
4,450 |
5,779 |
5,034 |
9,217 |
7,587 |
13,363 |
10,174 |
9,229 |
7,430 |
|
Native States ... |
............ |
............ |
............ |
............ |
............ |
............ |
............ |
............ |
7,481 |
7,348 |
|
Army— |
||||||||||
|
European ... |
............ |
............ |
............ |
............ |
............ |
............ |
............ |
............ |
......... |
............ |
|
Native ... |
............ |
............ |
............ |
............ |
83 |
43 |
............ |
............ |
620 |
396 |
|
Total ... |
131,111 |
120,082 |
133,472 |
122,186 |
146,338 |
134,579 |
177,356 |
161,625 |
197,572 |
184,225 |
C. P. COSTELLO, Surgeon-Colonel,
Set display mode to: Large image | Zoom image | Transcription
Images and transcriptions on this page, including medium image downloads, may be used under the Creative Commons Attribution 4.0 International Licence unless otherwise stated. ![]()
| Permanent URL | https://digital.nls.uk/91525276 |
|---|
| Additional NLS resources: | |
|---|---|
| Attribution and copyright: |
|
|---|


![[Page 1]](https://deriv.nls.uk/dcn4/9152/91525281.4.jpg)