Medicine - Vaccination > 1874-1927 - Annual vaccination report of the province of Assam > Vaccination report Assam 1874-1896 > 1886-1887 - Annual vaccination report of the Province of Assam for the year 1886-87
(227) Page 23
Download files
Individual page:
Thumbnail gallery: Grid view | List view

REPORT ON VACCINATION IN ASSAM. 23
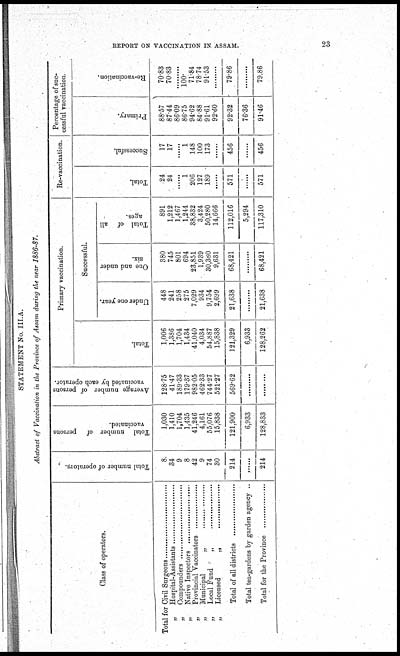
STATEMENT No. III.A.
Abstract of Vaccination in the Province of Assam during the near 1886-87.
|
Class of operators. |
Total number of operators. |
Total number of persons |
Average number of persons |
Primary vaccination. |
Re-vaccination. |
Percentage of suc- |
|||||
|
Total. |
Successful. |
Total. |
Successful. |
Primary. |
Re-vaccination. |
||||||
|
Under one year. |
One and under |
Total of all |
|||||||||
|
Total for Civil Surgeons ............... |
8 |
1,030 |
128.75 |
1,006 |
448 |
380 |
891 |
24 |
17 |
88.57 |
70.83 |
|
„ Hospital-Assistants ................... |
34 |
1,410 |
41.47 |
1,386 |
241 |
745 |
1,212 |
24 |
17 |
87.44 |
70.83 |
|
„ Compounders ...................... |
9 |
1,704 |
189.33 |
1,704 |
258 |
801 |
1,467 |
...... |
...... |
86.09 |
......... |
|
„ Native Inspectors .................... |
8 |
1,435 |
179.37 |
1,434 |
275 |
694 |
1,244 |
1 |
1 |
86.75 |
100. |
|
„ Provincial Vaccinators ............. |
42 |
41,246 |
982.05 |
41,040 |
7,029 |
23,851 |
38,832 |
206 |
148 |
94.62 |
71.84 |
|
„ Municipal „ ............... |
9 |
4,161 |
462.33 |
4,034 |
934 |
1,939 |
3,424 |
127 |
100 |
84.88 |
78.74 |
|
„ Local Fund „ ................. |
74 |
55,076 |
744.27 |
54,887 |
9,754 |
30,380 |
50,280 |
189 |
173 |
91.61 |
91.53 |
|
„ Licensed „ .............. |
30 |
15,838 |
521.27 |
15,838 |
2,699 |
9,631 |
14,666 |
...... |
...... |
92.60 |
......... |
|
Total of all districts ................. |
214 |
121,900 |
569.62 |
121,329 |
21,638 |
68,421 |
112,016 |
571 |
456 |
92.32 |
79.86 |
|
Total tea-gardens by garden agency .. |
...... |
6,933 |
......... |
6,933 |
......... |
......... |
5,294 |
...... |
...... |
76.36 |
......... |
|
Total for the Province ............. |
214 |
128,833 |
......... |
128,262 |
21,638 |
68,421 |
117,310 |
571 |
456 |
91.46 |
79.86 |
Set display mode to: Large image | Zoom image | Transcription
Images and transcriptions on this page, including medium image downloads, may be used under the Creative Commons Attribution 4.0 International Licence unless otherwise stated. ![]()
| Permanent URL | https://digital.nls.uk/91524775 |
|---|
| Additional NLS resources: | |
|---|---|
| Attribution and copyright: |
|
|---|


