Medicine - Vaccination > 1868-1929 - Report on the vaccine operations in the Central Provinces > Vaccine operations Central Provinces & Berar 1912-1920 > 1917-1918 - Notes on vaccination in the Central Provinces and Berar for the year 1917-18
(232) Page ii
‹‹‹ prev (231)
Half title page
Download files
Individual page:
Thumbnail gallery: Grid view | List view

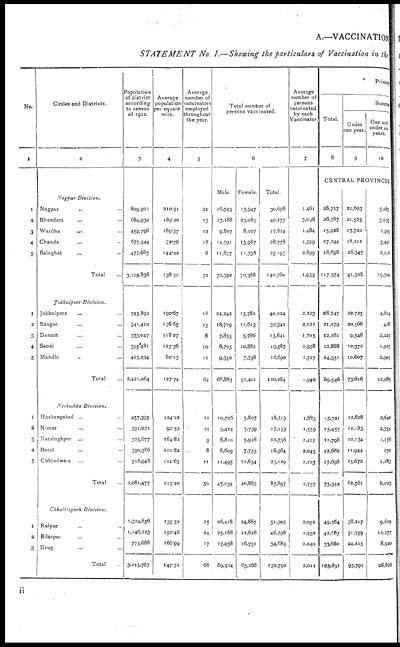
A.—VACCINATION
STATEMENT No. I.—Showing the particulars of Vaccination in the
|
No. |
Circles and Districts. |
Population |
Average |
Average |
Total number of |
Average |
Primary |
||||
|
Total. |
Success |
||||||||||
|
Under |
One and |
||||||||||
|
1 |
2 |
3 |
4 |
5 |
6 |
7 |
8 |
9 |
10 |
||
|
CENTRAL PROVINCES |
|||||||||||
|
Nagpur Division. |
Male. |
Female |
Total |
||||||||
|
1 |
Nagpur ... ... |
809,901 |
210.91 |
21 |
16,749 |
13,947 |
30,696 |
1,461 |
28,717 |
21,603 |
5,083 |
|
3 |
Bhandara ... ... |
684,930 |
189.20 |
13 |
17,188 |
23,089 |
40,277 |
3,098 |
26,787 |
21,525 |
5,055 |
|
3 |
Wardha ... ... |
459,796 |
189.37 |
12 |
9,807 |
8,007 |
17,814 |
1,484 |
15,928 |
13,720 |
1,905 |
|
4 |
Chanda ... ... |
677,544 |
72.76 |
18 |
14,791 |
13,987 |
28,778 |
1,599 |
27,244 |
18,111 |
5,441 |
|
5 |
Balaghat ... ... |
477,667 |
144.22 |
8 |
11,857 |
11,338 |
23,195 |
2,899 |
18,698 |
16,347 |
2,216 |
|
Total ... |
3,109,838 |
138.32 |
72 |
70,392 |
70,368 |
140,760 |
1,955 |
117,374 |
91,305 |
19,700 |
|
|
Jubbulpore Division. |
|||||||||||
|
1 |
Jubbulpore ... ... |
745,893 |
190.67 |
18 |
24,242 |
15,782 |
40,024 |
2,223 |
28,747 |
22,725 |
4,824 |
|
2 |
Saugor ... ... |
541,410 |
136.65 |
15 |
18,729 |
11,613 |
30,342 |
2,022 |
21,279 |
20,566 |
428 |
|
3 |
Damoh ... ... |
333,047 |
118.27 |
8 |
7,855 |
5,786 |
13,641 |
1,705 |
12,281 |
9,346 |
2,025 |
|
4 |
Seoni ... ... |
395,481 |
123.36 |
10 |
8,705 |
10,882 |
19,587 |
1,958 |
12,888 |
10,372 |
1,903 |
|
5 |
Mandla ... ... |
405,234 |
80.13 |
11 |
9,352 |
7,338 |
16,690 |
1,517 |
14,351 |
10,607 |
2,909 |
|
Total ... |
2,421,064 |
127.74 |
62 |
68,883 |
51,401 |
120,284 |
1,940 |
89,546 |
73,616 |
12,089 |
|
|
Nerbudda Division. |
|||||||||||
|
1 |
Hoshangabad ... ... |
457,395 |
124.22 |
11 |
10,705 |
7,807 |
18,513 |
1,683 |
15,721 |
12,628 |
2,640 |
|
2 |
Nimar ... ... |
391,071 |
92.52 |
11 |
9,414 |
7,739 |
17,153 |
1,559 |
15,457 |
12,183 |
2,754 |
|
3 |
Narsinghpur ... ... |
325,677 |
164.82 |
9 |
6,810 |
5,928 |
12,738 |
1,415 |
11,798 |
10,134 |
1,156 |
|
4 |
Betul ... ... |
390,386 |
100.82 |
8 |
8,609 |
7,755 |
16,364 |
2,045 |
12,668 |
11,944 |
270 |
|
5 |
Chhindwara ... ... |
516,948 |
111.63 |
11 |
11,495 |
11,634 |
23,129 |
2,103 |
17,698 |
15,672 |
1,183 |
|
Total ... |
2,081,477 |
113 20 |
50 |
47,034 |
40,863 |
87,897 |
1,757 |
73,342 |
62,561 |
8,003 |
|
|
Chhattisgarh Division. |
|||||||||||
|
1 |
Raipur ... ... |
1,324,856 |
135.52 |
25 |
26,418 |
24,887 |
51,305 |
2,052 |
49,564 |
38,217 |
9,629 |
|
2 |
Bilaspur ... ... |
1,146,223 |
150.46 |
24 |
25,168 |
21,628 |
46,796 |
1,950 |
42,667 |
31,359 |
10,277 |
|
3 |
Drug ... ... |
773,688 |
166.99 |
17 |
17,938 |
16,751 |
34,689 |
2,040 |
33,660 |
24,215 |
8,920 |
|
Total ... |
3,245,767 |
147.32 |
66 |
69,524 |
63,266 |
132,790 |
2,011 |
125,891 |
93.791 |
28,826 |
|
ii
Set display mode to: Large image | Zoom image | Transcription
Images and transcriptions on this page, including medium image downloads, may be used under the Creative Commons Attribution 4.0 International Licence unless otherwise stated. ![]()
| Permanent URL | https://digital.nls.uk/91522428 |
|---|
| Attribution and copyright: |
|
|---|


