Medicine - Vaccination > 1868-1929 - Report on the vaccine operations in the Central Provinces > Vaccine operations Central Provinces 1900-1911 > Notes on vaccination in the Central Provinces for the season 1902-1903
(145) Page ix
Download files
Individual page:
Thumbnail gallery: Grid view | List view

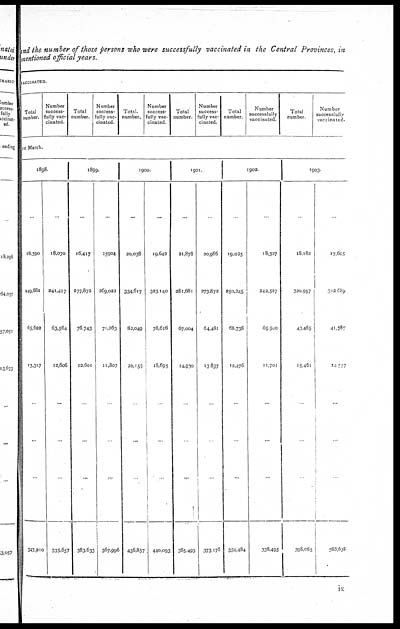
and the number of those persons who were successfully vaccinated in the Central Provinces, in
mentioned official years.
|
VACCINATED. |
|||||||||||
|
Total |
Number |
Total |
Number |
Total. |
Number |
Total |
Number |
Total |
Number |
Total |
Number |
|
1st March. |
|||||||||||
|
1898. |
1899. |
1900. |
1901. |
1902. |
1903 |
||||||
|
... |
... |
... |
... |
... |
... |
... |
... |
... |
... |
... |
... |
|
18,590 |
18,070 |
16,417 |
15,904 |
20,038 |
19,642 |
21,878 |
20,986 |
19,025 |
18,327 |
18,182 |
17,605 |
|
249,681 |
241,417 |
277,872 |
269,022 |
334,617 |
323,140 |
281,681 |
273,872 |
250,245 |
242,527 |
320,957 |
312,689 |
|
65,622 |
63,564 |
76,743 |
71,263 |
82,049 |
78,616 |
67,004 |
64,481 |
68,738 |
65,940 |
43,465 |
41,787 |
|
13,317 |
12,606 |
12,601 |
11,807 |
20,153 |
18,695 |
14,930 |
13,837 |
12,476 |
11,701 |
15,461 |
14,557 |
|
... |
... |
... |
... |
... |
... |
... |
... |
... |
... |
... |
... |
|
... |
... |
... |
... |
... |
... |
... |
... |
... |
... |
... |
... |
|
... |
... |
... |
... |
... |
... |
... |
... |
... |
... |
... |
... |
|
347,210 |
335,657 |
383,633 |
367,996 |
456,857 |
440,093 |
385,493 |
373,176 |
350,484 |
338,495 |
398,065 |
386,638 |
ix
Set display mode to: Large image | Zoom image | Transcription
Images and transcriptions on this page, including medium image downloads, may be used under the Creative Commons Attribution 4.0 International Licence unless otherwise stated. ![]()
| Permanent URL | https://digital.nls.uk/91520665 |
|---|
| Attribution and copyright: |
|
|---|


