

Medicine - Vaccination > 1868-1929 - Report on the vaccine operations in the Central Provinces > Vaccine operations Central Provinces 1886-1899 > 1896-1897 - Note on vaccination in the Central Provinces for the season 1896-97
(412) Page 5
Download files
Individual page:
Thumbnail gallery: Grid view | List view
5
Inspection.
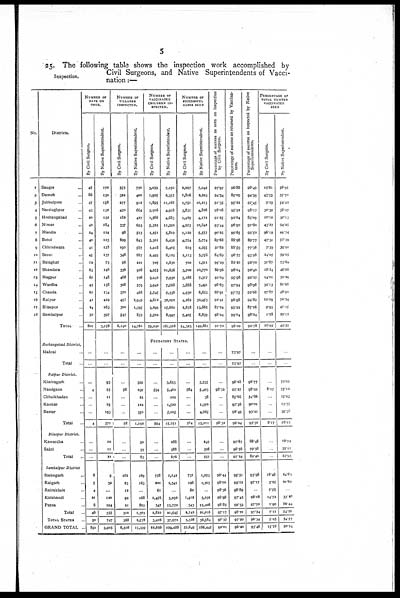
25. The following table shows the inspection work accomplished by
Civil Surgeons, and Native Superintendents of Vacci-
nation :—
|
No. |
Districts. |
NUMBER OF |
NUMBER OF |
NUMBER OF |
NUMBER OF |
Percentage of success as seen on inspection |
Percentage of success as returned by Vaccina- |
Percentage of success as inspected by Native |
PERCENTAGE OF |
|||||
|
By Civil Surgeon. |
By Native Superintendent. |
By Civil Surgeon. |
By Native Superintendent. |
By Civil Surgeon. |
By Native Superintendent. |
By Civil Surgeon. |
By Native Superintendent. |
By Civil Surgeon. |
By Native Superintendent. |
|||||
|
1 |
Saugor ... |
45 |
170 |
355 |
750 |
3,059 |
7,150 |
2,997 |
7,042 |
97.97 |
96.88 |
98.49 |
15.81 |
36.95 |
|
2 |
Damoh ... |
86 |
130 |
322 |
400 |
1,925 |
3,355 |
1,816 |
3,223 |
94.34 |
89.09 |
94.39 |
45.53 |
55.70 |
|
3 |
Jubbulpore ... |
47 |
138 |
277 |
912 |
1,895 |
11,168 |
1,731 |
10,213 |
91.35 |
95.22 |
91.45 |
9.23 |
54.42 |
|
4 |
Narsinghpur ... |
43 |
132 |
450 |
664 |
3,906 |
4,918 |
3,831 |
4,828 |
98.08 |
95.92 |
98.17 |
30.39 |
38.27 |
|
5 |
Hoshangabad ... |
20 |
132 |
182 |
427 |
1,566 |
4,683 |
1,439 |
4,172 |
91.25 |
92.04 |
89.09 |
10.10 |
30.13 |
|
6 |
Nimar ... |
40 |
184 |
337 |
693 |
5,322 |
11,592 |
4,973 |
10,642 |
93.44 |
96.90 |
91.80 |
43.27 |
94.25 |
|
7 |
Mandla ... |
24 |
124 |
98 |
513 |
1,251 |
5,819 |
1,139 |
5,557 |
90.25 |
99.65 |
95.50 |
96.19 |
44.74 |
|
8 |
Betul ... |
40 |
123 |
699 |
843 |
5,301 |
6,432 |
4,754 |
5,774 |
89.68 |
88.98 |
89.77 |
47.31 |
57.09 |
|
9 |
Chhindwara ... |
41 |
158 |
192 |
567 |
1,218 |
6,405 |
619 |
4,955 |
50.82 |
88.59 |
77.36 |
7.59 |
39.91 |
|
10 |
Seoni ... |
45 |
137 |
346 |
867 |
3,495 |
6,125 |
2,113 |
5,756 |
84.69 |
96.57 |
93.98 |
24.05 |
59.05 |
|
11 |
Balaghat ... |
12 |
73 |
96 |
221 |
705 |
1,630 |
700 |
1,511 |
99.29 |
83.20 |
92.70 |
31.87 |
73.09 |
|
12 |
Bhandara ... |
63 |
148 |
336 |
928 |
4,255 |
11,656 |
3,700 |
10,770 |
86.96 |
98.04 |
92.40 |
18.24 |
49.98 |
|
13 |
Nagpur ... |
67 |
148 |
468 |
726 |
3,442 |
7,930 |
3,168 |
7,317 |
92.04 |
95.98 |
92.27 |
14.01 |
32.10 |
|
14 |
Wardha ... |
45 |
138 |
308 |
579 |
3,942 |
7,568 |
3,888 |
7,491 |
98.63 |
97.94 |
98.98 |
32.13 |
61.68 |
|
15 |
Chanda ... |
67 |
134 |
370 |
468 |
5,545 |
9,336 |
4,930 |
8,653 |
88.91 |
97.75 |
92.68 |
27.87 |
46.92 |
|
16 |
Raipur ... |
42 |
429 |
457 |
2,949 |
4,612 |
32,092 |
4,262 |
30,453 |
92.41 |
96.98 |
94.89 |
10.09 |
70.24 |
|
17 |
Bilaspur ... |
24 |
263 |
300 |
1,395 |
3,299 |
15,660 |
3,878 |
13,665 |
87.34 |
95.22 |
87.26 |
9.93 |
47.15 |
|
18 |
Sambalpur ... |
50 |
397 |
547 |
859 |
5,502 |
8,997 |
5,405 |
8,839 |
98.24 |
99.04 |
98.24 |
1.78 |
29.12 |
|
TOTAL ... |
801 |
3,158 |
6,140 |
14,761 |
59,240 |
161,516 |
54,323 |
149,861 |
91.70 |
96.00 |
92.78 |
18.09 |
49.32 |
|
|
Hoshangabad District. |
FEUDATORY STATES. |
|||||||||||||
|
Makrai ... |
... |
... |
... |
... |
... |
... |
... |
... |
... |
73.97 |
... |
... |
... |
|
|
Total ... |
... |
... |
... |
... |
... |
... |
... |
... |
... |
73.97 |
... |
... |
... |
|
|
Raipur District. |
||||||||||||||
|
Khairagarh ... |
... |
93 |
... |
399 |
... |
3,653 |
... |
3,535 |
... |
98.28 |
96.77 |
... |
72.05 |
|
|
Nandgaon ... |
4 |
55 |
58 |
299 |
594 |
5,462 |
584 |
5,403 |
98.32 |
95.27 |
98.92 |
8.17 |
75.12 |
|
|
Chhuikhadan ... |
... |
11 |
... |
22 |
... |
109 |
... |
38 |
... |
85.66 |
34.86 |
... |
15.03 |
|
|
Kankar ... |
... |
19 |
... |
123 |
... |
1,523 |
... |
1,370 |
... |
97.36 |
90.01 |
... |
13.37 |
|
|
Bastar ... |
... |
193 |
... |
350 |
... |
5,005 |
... |
4,665 |
... |
96.49 |
93.21 |
... |
39.38 |
|
|
Total ... |
4 |
371 |
58 |
1,193 |
594 |
15,751 |
584 |
15,011 |
98.32 |
96.24 |
95.30 |
8.17 |
08.00 |
|
|
Bilaspur District. |
||||||||||||||
|
Kawardha ... |
... |
10 |
... |
50 |
... |
288 |
... |
249 |
... |
97.67 |
86.46 |
... |
16.74 |
|
|
Sakti ... |
... |
11 |
... |
33 |
... |
388 |
... |
308 |
... |
96.56 |
79.38 |
... |
35.11 |
|
|
Total ... |
... |
21 |
... |
83 |
... |
676 |
... |
557 |
... |
97.24 |
82.40 |
... |
23.93 |
|
|
Sambalpur District |
||||||||||||||
|
Sarangarh ... |
8 |
9 |
162 |
169 |
758 |
1,142 |
731 |
1,073 |
96.44 |
95.51 |
93.96 |
16.46 |
34.83 |
|
|
Raigarh ... |
5 |
32 |
23 |
163 |
300 |
1,341 |
196 |
1,303 |
98.00 |
99.12 |
97.17 |
3.35 |
21.80 |
|
|
Rairakhole ... |
4 |
... |
12 |
... |
61 |
... |
60 |
... |
98.36 |
98.89 |
... |
7.55 |
... |
|
|
Kalahandi ... |
21 |
120 |
93 |
168 |
1,456 |
3,292 |
1,412 |
3,332 |
96.98 |
97.45 |
98.18 |
14.73 |
33.28 |
|
|
Patna ... |
8 |
194 |
21 |
803 |
347 |
15,770 |
343 |
15,408 |
98.85 |
99.33 |
97.70 |
1.90 |
86.44 |
|
|
Total ... |
46 |
355 |
310 |
1,303 |
3,822 |
21,545 |
3,743 |
21,016 |
97.17 |
98.21 |
97.34 |
7.11 |
54.28 |
|
|
TOTAL STATES ... |
50 |
747 |
368 |
2,578 |
3,416 |
37,972 |
3,326 |
36,584 |
97.37 |
97.20 |
96.34 |
5.05 |
54.57 |
|
|
GRAND TOTAL .. |
851 |
3,905 |
6,508 |
17,339 |
62,656 |
199,488 |
57,649 |
186,445 |
92.01 |
96.20 |
93.46 |
15.78 |
50.24 |
|
Set display mode to: Large image | Zoom image | Transcription
Images and transcriptions on this page, including medium image downloads, may be used under the Creative Commons Attribution 4.0 International Licence unless otherwise stated. ![]()
| Permanent URL | https://digital.nls.uk/91486392 |
|---|
| Attribution and copyright: |
|
|---|
| Description | Covers 1868-1929. Details and appraises vaccination operations in the Central Provinces. Describes supply of lymph. Tables show particulars of vaccination. Success and mortality rates noted. Foldout diagrams included. |
|---|---|
| Shelfmark | IP/19/VA.3 |
| Additional NLS resources: | |
| Description | The Vaccination collection consists of 66 volumes dating from 1856 to 1933. Reports show how vaccination against smallpox was implemented in India. They reveal the shift from variolation, improved vaccination techniques, logistics of lymph supply, funding and staffing. They explore how the local population viewed and resisted western vaccination. |
|---|---|
| Description | The India Papers collection contains publications of the central (Imperial) Government and many Indian states. Most states came under British rule. Much of the collection dates from between the post-Mutiny re-organisation of the Indian Government and Indian Independence in 1947. Some items published in London by John Murray. |
|---|---|
| Shelfmark | India Papers |
| Additional NLS resources: | |