

Medicine - Vaccination > 1868-1929 - Report on the vaccine operations in the Central Provinces > Vaccine operations Central Provinces 1886-1899 > 1895-1896 - [Triennial] report on the vaccine operations in the Central Provinces for the year 1895-96
(368) Page 2
![[Page 1]](https://deriv.nls.uk/dcn4/9148/91486259.4.jpg)
Download files
Individual page:
Thumbnail gallery: Grid view | List view
2
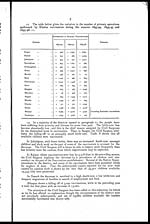
It will be seen that for 1895-96 there has been a very considerable falling-off
in the work done both by vaccinators and at dispensaries, amounting in all
to a diminution of 23,790 operations as compared with 1894-95, while, as
compared with 1893-94, the returns show an increase of 5,916. The decrease
last year was entirely confined to the Khalsa.
STATEMENT I.
Operations by Vaccinators in the Khalsa and Feudatory States.
4. The number of vaccinations for last working season, both primary and
secondary, was 449,720, or 20,872 less than in 1894-95, although it was larger
by 9,064 than the total for 1893-94.
5. The percentage of success in primary vaccination was 96.37 as compared
with 96.42 in 1894-95, and 95.48 in 1893-94, while re-vaccination had an average
of success of 82.11 as against 78.18 and 79.87 in the foregoing two years.
Operations by Khalsa Vaccinators.
6. Excluding the returns from Native States, the entire number of primary
operations was less by 33,925 than in 1894-95, but as the re-vaccinations went up
by 5,484, the net total decrease was 28,441, as compared with 1893-94; primary
vaccinations were fewer by 6,123 and re-vaccinations larger by 416.
7. As compared with the seasons of 1893-94 and 1894-95, the work done
in dispensaries by Hospital Assistants has decreased by 1,662 and 2,270 primary
vaccinations and 649 and 668 re-vaccinations in the last two years.
8. The number of children, under one year of age, successfully vaccinated
in the Khalsa during the last five years was as follows:—
|
1891-92 ... ... ... |
220,031 |
|
1892-93 ... ... ... |
227,553 |
|
1898-94 ... ... ... |
215,806 |
|
1894-95 ... ... ... |
231,097 |
|
1895-96 ... ... ... |
209,317 |
The results of last season were therefore the most unfavourable of the series.
9. The table below gives the percentage of success claimed to have been
obtained by the vaccinators, and the same as checked by Native Superintendents
and Civil Surgeons:—
|
Years. |
Claimed by Vaccina- |
As seen by Civil |
As seen by Native |
|
1893-94 ... ... |
95.28 |
88.76 |
91.56 |
|
1894-95 ... ... |
96.31 |
86.67 |
91.69 |
|
1895-96 ... ... |
95.88 |
87.62 |
91.01 |
10. The reports show that throughout last working season each vaccina-
tor performed on the average 1,765 operations, fewer by 130 than in 1894-95 and
by 41 than in 1893-94.
The work done by individuals varied last year from 861 in the Damoh
District to 2,518 in that of Chhindwara.
11. Three only of the 18 districts in the Provinces show an improvement
in results as regards primary operations in their last returns, viz., Nimar, which
had an increase of 856, Narsinghpur of 484, and Mandla of 70.
The decrease in the others ranged from 6,831 in Saugor to 252 in Sambal-
pur, and is most marked in the figures from Saugor, Jubbulpore, Raipur, Damoh,
Bilaspur, Nagpur, Balaghat and Chanda.
Set display mode to: Large image | Zoom image | Transcription
Images and transcriptions on this page, including medium image downloads, may be used under the Creative Commons Attribution 4.0 International Licence unless otherwise stated. ![]()
| Permanent URL | https://digital.nls.uk/91486260 |
|---|
| Attribution and copyright: |
|
|---|
| Description | Covers 1868-1929. Details and appraises vaccination operations in the Central Provinces. Describes supply of lymph. Tables show particulars of vaccination. Success and mortality rates noted. Foldout diagrams included. |
|---|---|
| Shelfmark | IP/19/VA.3 |
| Additional NLS resources: | |
| Description | The Vaccination collection consists of 66 volumes dating from 1856 to 1933. Reports show how vaccination against smallpox was implemented in India. They reveal the shift from variolation, improved vaccination techniques, logistics of lymph supply, funding and staffing. They explore how the local population viewed and resisted western vaccination. |
|---|---|
| Description | The India Papers collection contains publications of the central (Imperial) Government and many Indian states. Most states came under British rule. Much of the collection dates from between the post-Mutiny re-organisation of the Indian Government and Indian Independence in 1947. Some items published in London by John Murray. |
|---|---|
| Shelfmark | India Papers |
| Additional NLS resources: | |