

Medicine - Vaccination > 1868-1929 - Report on the vaccine operations in the Central Provinces > Vaccine operations Central Provinces 1886-1899 > 1891-1892 - Notes on the annual statements of vaccine operations in the Central Provinces for the year 1891-92
(219) [Page 1]

Download files
Individual page:
Thumbnail gallery: Grid view | List view
![(7) [Page 1] -](https://deriv.nls.uk/dcn17/9142/91428741.17.jpg)
Notes on the Annual Statements of Vaccine operations in the
Central Provinces for the year 1891-92.
The following brief notes on the operations of 1891-92 are given with
reference to, and in explanation of the appended Statements.
2. The area in which vaccine operations were performed in 1891-92
remained about the same as in 1890-91, but in the year under review 293
operations performed in the Makrai State, in the Hoshangabad District, have
been included in the Statement.
STATEMENT I.
3. The Provincial strength of the Vaccine Department was increased
by 2, as compared with that of the previous year. One extra vaccinator each,
was employed by the Harda and Chanda Municipalities. The strength of the
Vaccine establishment in the Feudatory States also was increased by 5 vacci-
nators, as follows:—
|
In the Kanker State |
1 |
|
„ Sonepur ... |
2 |
|
„ Bamra ... |
1 |
|
„ Makrai (newly added) ... |
1 |
|
Total ... |
5 |
4. The total number of operations performed in the year 1891-92 both
in the Khalsa and Feudatory States, excluding the operations performed in the
Makrai State, was 445,427, or 3,438 more than in the previous year.
While there was an increase in the number of primary operations, the total
of persons re-vaccinated remained about the same as in 1890-91.
5. The number of successful primary operations, excluding the figures of
the Makrai State, increased by 3,434.
6. It is very satisfactory to record that the operations performed on
infants, both in the Khalsa and Feudatory States, again increased this year by
17,321, as shown below :—
|
Operations performed |
|
|
In the Khalsa ... |
13,715 |
|
„ Feudatory States ... |
3,606 |
|
Total ... |
17,321 |
In the above calculation the operations performed in the Makrai State
are not included.
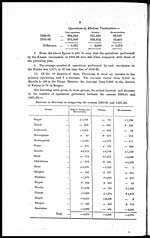
7. The percentage of successful primary vaccinations remained almost
the same as in 1890-91, but re-vaccinations were 1.95 per cent. greater than in
the preceding year. Thus:—
Percentage of successful operations.
|
Primary. |
Re-vaccinations. |
|
|
1890-91 ... |
96.39 |
77.62 |
|
1891-92 ... |
96.40 |
79.57 |
|
Difference ... |
+ 1.95 |
|
Set display mode to: Large image | Zoom image | Transcription
Images and transcriptions on this page, including medium image downloads, may be used under the Creative Commons Attribution 4.0 International Licence unless otherwise stated. ![]()
| Permanent URL | https://digital.nls.uk/91428739 |
|---|
| Attribution and copyright: |
|
|---|
| Description | Covers 1868-1929. Details and appraises vaccination operations in the Central Provinces. Describes supply of lymph. Tables show particulars of vaccination. Success and mortality rates noted. Foldout diagrams included. |
|---|---|
| Shelfmark | IP/19/VA.3 |
| Additional NLS resources: | |
| Description | The Vaccination collection consists of 66 volumes dating from 1856 to 1933. Reports show how vaccination against smallpox was implemented in India. They reveal the shift from variolation, improved vaccination techniques, logistics of lymph supply, funding and staffing. They explore how the local population viewed and resisted western vaccination. |
|---|---|
| Description | The India Papers collection contains publications of the central (Imperial) Government and many Indian states. Most states came under British rule. Much of the collection dates from between the post-Mutiny re-organisation of the Indian Government and Indian Independence in 1947. Some items published in London by John Murray. |
|---|---|
| Shelfmark | India Papers |
| Additional NLS resources: | |