Medicine - Vaccination > 1877-1929 - Report on vaccination in the Madras Presidency > Report on vaccination in Madras 1922-1929 > 1928-1929 - Report on vaccination in the Madras Presidency for the triennium ending 1928-29
(480) Page 24
Download files
Individual page:
Thumbnail gallery: Grid view | List view

24
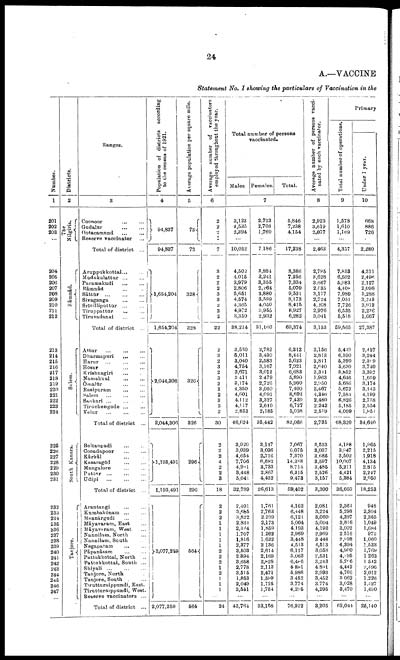
A.—VACCINE
Statement No. I showing the particulars of Vaccination in the
|
Number. |
Districts. |
Ranges. |
Population of districts according |
Average population per square mile. |
Average number of vaccinators |
Total number of personas |
Average number of persons vacci- |
Primary |
|||
|
Total number of operations. |
|||||||||||
|
Under 1 year. |
|||||||||||
|
Males |
Females. |
Total. |
|||||||||
|
1 |
2 |
3 |
4 |
5 |
6 |
7 |
8 |
9 |
10 |
||
|
201 |
The |
Coonoor ... ... |
94,837 |
73 |
2 |
3,123 |
2,723 |
5,846 |
2,923 |
1,578 |
668 |
|
202 |
Godalur ... ... |
2 |
4,535 |
2,703 |
7,238 |
3,619 |
1,610 |
886 |
|||
|
203 |
Ootacamund ... ... |
2 |
2,394 |
1,760 |
4,154 |
2,077 |
1,169 |
726 |
|||
|
... |
Reserve vaccinator ... |
1 |
... |
... |
... |
... |
... |
... |
|||
|
Total of district ... |
94,837 |
73 |
7 |
10,052 |
7,186 |
17,238 |
2,463 |
4,357 |
2,280 |
||
|
204 |
Rāmnād. |
Aruppukkottai ... ... |
1,654,204 |
328 |
3 |
4,502 |
3,884 |
8,386 |
2,795 |
7,853 |
4,311 |
|
205 |
Mudukulattur ... ... |
2 |
4,015 |
3,241 |
7,256 |
3,628 |
6,502 |
2,496 |
|||
|
206 |
Paramakudi ... ... |
2 |
3,979 |
3,355 |
7,334 |
3,667 |
5,983 |
2,127 |
|||
|
207 |
Rāmnād ... ... |
2 |
2,806 |
2,264 |
5,070 |
2,535 |
4,408 |
2,098 |
|||
|
208 |
Sāttūr ... ... ... |
3 |
5,651 |
3,880 |
9,531 |
3,177 |
7,989 |
5,288 |
|||
|
209 |
Sivaganga ... ... |
3 |
4,574 |
3,599 |
8,173 |
2,724 |
7,051 |
3,245 |
|||
|
210 |
Srīvilliputtūr ... ... |
2 |
4,365 |
4,050 |
8,415 |
4,208 |
7,726 |
3,913 |
|||
|
211 |
Tiruppattūr ... ... |
3 |
4,972 |
3,955 |
8,927 |
2,976 |
6,535 |
2,236 |
|||
|
212 |
Tiruvadanai ... ... |
2 |
3,350 |
2,932 |
6,282 |
3,041 |
5,518 |
1,667 |
|||
|
Total of district ... |
1,654,204 |
328 |
22 |
38,214 |
31,160 |
69,374 |
3,153 |
59,565 |
27,387 |
||
|
213 |
Salem. |
Attur ... ... ... |
2,044,306 |
... |
2 |
3,530 |
2,782 |
6,312 |
3,156 |
5,449 |
2,427 |
|
214 |
Dharmapuri ... ... |
3 |
5,011 |
3,430 |
8,441 |
2,813 |
6,390 |
3,244 |
|||
|
215 |
Harur ... ... ... |
2 |
3,040 |
2,583 |
5,623 |
2,811 |
5,390 |
2,399 |
|||
|
216 |
Hosur ... ... |
3 |
4,754 |
3,167 |
7,921 |
2,640 |
5,630 |
3,740 |
|||
|
217 |
Krishnagiri ... ... |
2 |
3,671 |
3,012 |
6,683 |
3,311 |
5,852 |
3,392 |
|||
|
218 |
Namakkal ... ... |
3 |
3,411 |
2,479 |
5,890 |
1,963 |
4,646 |
1,659 |
|||
|
219 |
ōmalūr ... ... |
2 |
3,174 |
2,726 |
5,900 |
2,950 |
5,686 |
3,174 |
|||
|
220 |
Rasipuram ... ... |
3 |
4,350 |
3,050 |
7,400 |
2,467 |
5,673 |
3,143 |
|||
|
221 |
Salem ... ... ... |
2 |
4,601 |
4,091 |
8,692 |
4,346 |
7,584 |
4,199 |
|||
|
222 |
Sankari ... ... ... |
3 |
4,112 |
3,327 |
7,439 |
2,480 |
6,826 |
2,758 |
|||
|
223 |
Tiruchengode ... ... |
3 |
4,117 |
2,610 |
6,727 |
2,242 |
5,185 |
2,554 |
|||
|
224 |
Velur ... ... ... |
2 |
2,853 |
2,185 |
5,038 |
2,519 |
4,009 |
1,951 |
|||
|
Total of district ... |
2,044,306 |
326 |
30 |
46,624 |
35,442 |
82,066 |
2,735 |
68,320 |
34,640 |
||
|
225 |
South Kanara. |
Beltangadi ... ... |
1,193,491 |
296 |
2 |
3,920 |
3,147 |
7,067 |
3,533 |
4,188 |
1,965 |
|
226 |
Coondapoor ... ... |
2 |
3,039 |
3,036 |
6,075 |
3,037 |
3,047 |
2,215 |
|||
|
227 |
Kārkāl ... ... ... |
2 |
4,654 |
2,716 |
7,370 |
3,685 |
3,502 |
1,918 |
|||
|
228 |
Kasaragōd ... ... |
4 |
7,706 |
6,682 |
14,388 |
3,597 |
10,007 |
4,134 |
|||
|
229 |
Mangalore ... ... |
2 |
4,981 |
3,733 |
8,714 |
3,485 |
5,211 |
2,815 |
|||
|
230 |
Puttur ... ... ... |
2 |
3,448 |
2,867 |
6,315 |
2,526 |
4,421 |
2,247 |
|||
|
231 |
Udipi ... ... ... |
3 |
5,041 |
4,432 |
9,473 |
3,157 |
5,384 |
2,959 |
|||
|
Total of district ... |
1,193,491 |
296 |
18 |
32,789 |
26,613 |
59,402 |
3,300 |
36,660 |
18,253 |
||
|
232 |
Tanjore. |
Arantangi ... ... |
2,077,259 |
564 |
2 |
2,401 |
1,761 |
4,162 |
2,081 |
2,364 |
948 |
|
233 |
Kumbakōnam ... ... |
2 |
3,685 |
2,763 |
6,448 |
3,224 |
5,298 |
2,304 |
|||
|
234 |
Mannārgudi ... ... |
2 |
3,822 |
2,299 |
6,121 |
3,060 |
4,397 |
2,365 |
|||
|
235 |
Māyavaram, East ... |
1 |
2,831 |
2,173 |
5,004 |
5,004 |
3,816 |
1,049 |
|||
|
236 |
Māyavaram, West ... |
1 |
2,334 |
1,859 |
4,193 |
4,193 |
3,092 |
1,684 |
|||
|
237 |
Nannilam, North ... |
1 |
1,707 |
1,262 |
2,969 |
2,969 |
2,516 |
972 |
|||
|
238 |
Nannilam, South ... |
1 |
1,816 |
1,632 |
3,448 |
3,448 |
2,098 |
1,060 |
|||
|
239 |
Negapatam ... ... |
1 |
2,377 |
2,136 |
4,513 |
4,513 |
4,394 |
1,533 |
|||
|
240 |
Pāpanāsam ... ... |
2 |
3,503 |
2,614 |
6,117 |
3,058 |
4,900 |
1,769 |
|||
|
241 |
Pattukkōttai, North ... |
2 |
2,894 |
2,169 |
5,063 |
2,531 |
4,295 |
1,263 |
|||
|
242 |
Pattukkottai, South ... |
2 |
3,658 |
2,828 |
6,406 |
3,243 |
5,266 |
1,542 |
|||
|
243 |
Shiyali ... ... ... |
1 |
2,778 |
2,113 |
4 891 |
4,89l |
4,442 |
2,496 |
|||
|
244 |
Tanjore, North ... |
2 |
3,515 |
2,471 |
5,986 |
2,993 |
4,706 |
2,012 |
|||
|
245 |
Tanjore, South ... |
1 |
1,853 |
1,599 |
3,452 |
3,452 |
3,062 |
1,226 |
|||
|
246 |
Tirutturaippundi, East. |
1 |
2,049 |
1,725 |
3,774 |
3,774 |
3,028 |
1,427 |
|||
|
247 |
Tirutturaippundi, West. |
1 |
2,541 |
1,754 |
4,295 |
4,295 |
3,470 |
1,490 |
|||
|
Reserve vaccinators ... |
... |
... |
... |
... |
... |
... |
... |
||||
|
Total of district ... |
2,077,259 |
564 |
24 |
43,764 |
33,158 |
76,922 |
3,205 |
62,044 |
23,140 |
||
Set display mode to: Large image | Zoom image | Transcription
Images and transcriptions on this page, including medium image downloads, may be used under the Creative Commons Attribution 4.0 International Licence unless otherwise stated. ![]()
| Permanent URL | https://digital.nls.uk/91181180 |
|---|
| Attribution and copyright: |
|
|---|


