Medicine - Vaccination > 1877-1929 - Report on vaccination in the Madras Presidency > Report on vaccination in Madras 1922-1929 > 1928-1929 - Report on vaccination in the Madras Presidency for the triennium ending 1928-29
(478) Page 22
Download files
Individual page:
Thumbnail gallery: Grid view | List view

22
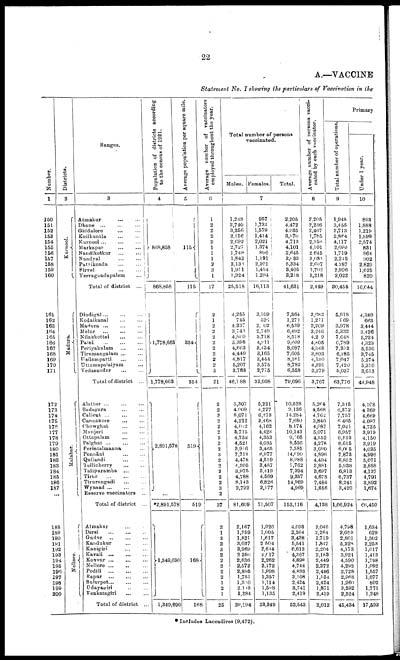
A.—VACCINE
Statement No. I showing the particulars of Vaccination in the
|
Number. |
Districts. |
Ranges. |
Population of districts according |
Average population per square mile. |
Average number of vaccinators |
Total number of persons |
Average number of persons vacci- |
Primary |
|||
|
Total number of operations. |
|||||||||||
|
Under 1 year. |
|||||||||||
|
Males. |
Females. |
Total. |
|||||||||
|
1 |
2 |
3 |
4 |
5 |
6 |
7 |
8 |
9 |
10 |
||
|
150 |
Kurnool. |
Atmakur ... ... |
868,858 |
115 |
1 |
1,248 |
957 |
2,205 |
2,205 |
1,945 |
893 |
|
151 |
Dhone ... ... ... |
2 |
2,740 |
1,782 |
4,472 |
2,236 |
3,455 |
1,888 |
|||
|
152 |
Giddalore ... ... |
2 |
3,356 |
1,579 |
4,935 |
2,467 |
2,713 |
1,219 |
|||
|
153 |
Koilkuntla ... ... |
2 |
2,156 |
1,414 |
3,570 |
1,785 |
2,864 |
1,599 |
|||
|
154 |
Kurnool ... ... ... |
2 |
2,692 |
2,021 |
4,713 |
2,356 |
4,117 |
2,574 |
|||
|
155 |
Markapur ... ... |
1 |
2,727 |
1,374 |
4,101 |
4,101 |
2,090 |
831 |
|||
|
156 |
Nandikotkur ... ... |
1 |
1,749 |
896 |
2,645 |
2,645 |
1,719 |
864 |
|||
|
157 |
Nandyal ... ... |
1 |
1,842 |
1,191 |
3,033 |
3,033 |
2,246 |
902 |
|||
|
158 |
Pattikonda ... ... |
2 |
3,138 |
2,201 |
5,334 |
2,667 |
4,287 |
2,829 |
|||
|
159 |
Sirvel ... ... |
2 |
1,951 |
1,454 |
3,405 |
1,702 |
2,996 |
1,625 |
|||
|
160 |
Yerragundapalem ... |
1 |
1,924 |
1,294 |
3,218 |
3,218 |
2,022 |
820 |
|||
|
Total of district ... |
868,858 |
115 |
17 |
25,518 |
16,113 |
41,631 |
2,449 |
30,454 |
16,044 |
||
|
161 |
Madura. |
Dindigul... ... ... |
1,778,663 |
354 |
2 |
4,255 |
3,109 |
7,364 |
3,682 |
5,918 |
4,380 |
|
162 |
Kodaikanal ... ... |
1 |
745 |
526 |
1,271 |
1,271 |
969 |
663 |
|||
|
163 |
Madura ... ... |
2 |
4,337 |
2,002 |
6,539 |
3,269 |
3,978 |
3,444 |
|||
|
164 |
Melur ... ... ... |
2 |
8,743 |
2,749 |
6,492 |
3,246 |
5,332 |
3,426 |
|||
|
165 |
Nilakkottai ... ... |
2 |
4,860 |
3,718 |
8,518 |
4,209 |
7,648 |
5,234 |
|||
|
166 |
Palni ... ... ... |
2 |
5,398 |
4,211 |
9,609 |
4,805 |
6,789 |
4,323 |
|||
|
167 |
Periyakulam ... ... |
2 |
4,663 |
3,434 |
8,097 |
4,048 |
7,353 |
5,536 |
|||
|
168 |
Tirumangalam ... ... |
2 |
4,440 |
3,165 |
7,605 |
3,803 |
6,285 |
3,745 |
|||
|
169 |
Usilampatti ... ... |
2 |
4,817 |
3,444 |
8,261 |
4,130 |
7,047 |
5,274 |
|||
|
170 |
Uttamapalaiyam ... |
2 |
5,207 |
3,575 |
8,782 |
4,391 |
7,420 |
5,310 |
|||
|
171 |
Vedasandur ... |
2 |
3,783 |
2,775 |
6,558 |
3,279 |
5,037 |
3,613 |
|||
|
Total of district ... |
1,778,663 |
354 |
21 |
46,188 |
32,908 |
79,096 |
3,767 |
63,776 |
44,948 |
||
|
172 |
Malabar. |
Alattur ... ... ... |
2,891,578 |
519 |
2 |
5,307 |
5,221 |
10,528 |
5,264 |
7,345 |
4,108 |
|
173 |
Badagara ... ... |
2 |
4,909 |
4,227 |
9,136 |
4,568 |
6,372 |
4,369 |
|||
|
174 |
Calicut ... ... ... |
3 |
8,071 |
6,213 |
14,284 |
4,762 |
7,757 |
4,669 |
|||
|
175 |
Cannanore ... ... |
2 |
4,212 |
3,468 |
7,680 |
3,840 |
6,465 |
4,097 |
|||
|
176 |
Chowghat ... ... |
2 |
4,012 |
4,162 |
8,174 |
4,087 |
7,021 |
4,735 |
|||
|
177 |
Manjeri ... ... |
2 |
5,715 |
4,428 |
10,143 |
5,071 |
6,957 |
3,919 |
|||
|
178 |
Ottapalam ... ... |
2 |
4,752 |
4,353 |
9,105 |
4,552 |
6,513 |
4,150 |
|||
|
179 |
Palghat ... ... ... |
2 |
4,521 |
4,035 |
8,556 |
4,278 |
6,615 |
3,919 |
|||
|
180 |
Perintalmanna ... |
2 |
3,916 |
3,465 |
7,381 |
3,690 |
6,005 |
4,035 |
|||
|
181 |
Ponnāni ... ... |
3 |
7,713 |
6,977 |
14,090 |
4,896 |
7,873 |
4,996 |
|||
|
182 |
Quilandi ... ... |
2 |
4,478 |
4,510 |
8,988 |
4,494 |
6,852 |
5,071 |
|||
|
183 |
Tellicherry ... ... |
2 |
4,305 |
3,457 |
7,762 |
3,881 |
5,938 |
3,888 |
|||
|
184 |
Taliparamba ... ... |
2 |
3,975 |
3,419 |
7,394 |
3,697 |
6,813 |
4,137 |
|||
|
185 |
Tirur ... ... ... |
2 |
4,788 |
4,569 |
9,357 |
4,678 |
6,737 |
4,791 |
|||
|
186 |
Tirurangadi ... ... |
2 |
8,143 |
6,826 |
14,969 |
7,484 |
8,241 |
3,892 |
|||
|
187 |
Wynaad ... ... ... |
3 |
2,792 |
2,177 |
4,969 |
1,656 |
3,420 |
1,674 |
|||
|
... |
Reserve vaccinators ... |
... |
... |
2 |
|||||||
|
Total of district ... |
*2,891,578 |
519 |
37 |
81,609 |
71,507 |
153,116 |
4,138 |
1,06,924 |
66,450 |
||
|
188 |
Nellore. |
Atmakur ... ... |
1,349,690 |
168 |
2 |
2,167 |
1,926 |
4,093 |
2,046 |
4,798 |
1,634 |
|
189 |
Darsi ... ... ... |
1 |
1,259 |
1,005 |
2,264 |
2,264 |
2,059 |
629 |
|||
|
190 |
Gudur ... ... ... |
2 |
1,821 |
1,617 |
3,438 |
1,719 |
2,801 |
1,302 |
|||
|
191 |
Kandukur ... ... |
3 |
3,037 |
2,504 |
5,541 |
1,847 |
5,228 |
2,253 |
|||
|
192 |
Kanigiri ... ... |
3 |
3,969 |
2,644 |
6,613 |
2,204 |
4,173 |
1,017 |
|||
|
193 |
Kavali ... ... ... |
2 |
2,350 |
2,017 |
4,367 |
2,188 |
3,921 |
1,413 |
|||
|
194 |
Kovvur ... ... ... |
2 |
2,636 |
2,262 |
4,898 |
2,449 |
4,590 |
1,798 |
|||
|
195 |
Nellore ... ... ... |
2 |
2,572 |
2,172 |
4,744 |
2,372 |
4,292 |
1,092 |
|||
|
190 |
Podili ... ... ... |
2 |
2,895 |
1,998 |
4,893 |
2,446 |
2,728 |
1,557 |
|||
|
197 |
Rapur ... ... ... |
2 |
1,751 |
1,357 |
3,108 |
1,554 |
2,968 |
1,077 |
|||
|
198 |
Sulurpet ... ... ... |
1 |
1,310 |
1,114 |
2,424 |
2,424 |
1,960 |
802 |
|||
|
199 |
Udayagiri ... ... ... |
2 |
2,143 |
1,598 |
3,741 |
1,871 |
3,592 |
1,771 |
|||
|
200 |
Venkatagiri ... ... |
1 |
1,284 |
1,135 |
2,419 |
2,419 |
2,324 |
1,248 |
|||
|
Total of district ... |
1,349,690 |
168 |
25 |
29,194 |
23,349 |
52,543 |
2,012 |
45,434 |
17,593 |
||
*Includes Laccadives (9,472).
Set display mode to: Large image | Zoom image | Transcription
Images and transcriptions on this page, including medium image downloads, may be used under the Creative Commons Attribution 4.0 International Licence unless otherwise stated. ![]()
| Permanent URL | https://digital.nls.uk/91181174 |
|---|
| Attribution and copyright: |
|
|---|


