Medicine - Vaccination > 1877-1929 - Report on vaccination in the Madras Presidency > Report on vaccination in Madras 1922-1929 > 1928-1929 - Report on vaccination in the Madras Presidency for the triennium ending 1928-29
(472) Page 16
Download files
Individual page:
Thumbnail gallery: Grid view | List view

16
VACCINATION
A.—VACCINE
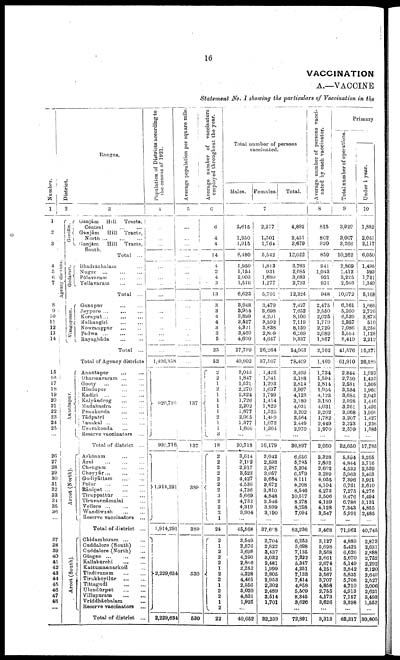
Statement No. I showing the particulars of Vaccination in the
|
Number. |
District. |
Ranges. |
Population of Districts according to |
Average population per square mile. |
Average number of vaccinators |
Total number of persons |
Average number of persons vacci- |
Primary |
||||
|
Total number of operations. |
||||||||||||
|
Under 1 year. |
||||||||||||
|
Males. |
Females. |
Total. |
||||||||||
|
1 |
2 |
3 |
4 |
5 |
6 |
7 |
8 |
9 |
10 |
|||
|
1 |
Agency districts. |
Ganjām. |
Ganjām Hill Tracts, |
... |
... |
6 |
2,615 |
2,277 |
4,892 |
815 |
3,929 |
1,882 |
|
2 |
Ganjām Hill Tracts, |
... |
... |
4 |
1,950 |
1,501 |
3,451 |
862 |
3,067 |
2,051 |
||
|
3 |
Ganjām Hill Tracts, |
... |
... |
4 |
1,915 |
1,764 |
3,679 |
920 |
3,266 |
2,117 |
||
|
Total ... |
... |
... |
14 |
6,480 |
5,542 |
12,022 |
859 |
10,262 |
6,050 |
|||
|
4 |
Godavari. |
Bhadrāchalam ... |
... |
... |
4 |
1,950 |
1,813 |
3,763 |
941 |
2,869 |
1,495 |
|
|
5 |
Nugur ... ... ... |
... |
... |
2 |
1,154 |
931 |
2,085 |
1,043 |
1,412 |
593 |
||
|
6 |
Polavaram ... ... |
... |
... |
4 |
2,003 |
1,680 |
3,683 |
921 |
3,225 |
1,731 |
||
|
7 |
Yellavaram ... ... |
... |
... |
3 |
1,516 |
1,277 |
2,793 |
931 |
2,566 |
1,349 |
||
|
Total ... |
... |
... |
13 |
6,623 |
5,701 |
12,324 |
948 |
10,072 |
5,168 |
|||
|
8 |
Vizagapatam. |
Gunupur ... ... |
... |
... |
3 |
3,948 |
3,479 |
7,427 |
2,475 |
6,361 |
1,666 |
|
|
9 |
Jeypore ... ... ... |
... |
... |
3 |
3,954 |
3,698 |
7,652 |
2,550 |
5,260 |
2,726 |
||
|
10 |
Koraput... ... ... |
... |
... |
4 |
3,899 |
4,201 |
8,100 |
2,025 |
6,539 |
3,873 |
||
|
11 |
Malkangiri ... ... |
... |
... |
4 |
3,527 |
3,592 |
7,119 |
1,779 |
2,357 |
510 |
||
|
12 |
Nowrangpur ... ... |
... |
... |
3 |
4,321 |
3,838 |
8,159 |
2,720 |
7,086 |
3,256 |
||
|
13 |
Padwa ... ... ... |
... |
... |
3 |
3,460 |
2,809 |
6,269 |
2,089 |
5,554 |
1,128 |
||
|
14 |
Rayaghāda ... ... |
... |
... |
5 |
4,690 |
4,647 |
9,337 |
1,867 |
8,419 |
2,212 |
||
|
Total ... |
... |
... |
25 |
27,799 |
26,264 |
54,063 |
2,162 |
41,576 |
15,371 |
|||
|
Total of Agency districts |
1,496,358 |
... |
52 |
40,902 |
37,507 |
78,409 |
1,469 |
61,910 |
26,589 |
|||
|
15 |
Anantapur. |
Anantapur ... ... |
920,716 |
137 |
2 |
2,043 |
1,426 |
3,469 |
1,734 |
2,844 |
1,939 |
|
|
16 |
Dharmavaram ... ... |
2 |
1,847 |
1,341 |
3,188 |
1,594 |
2,750 |
1,433 |
||||
|
17 |
Gooty ... ... ... |
1 |
1,521 |
1,203 |
2,814 |
2,814 |
2,581 |
1,509 |
||||
|
18 |
Hindupur ... ... |
2 |
2,270 |
1,637 |
3,907 |
1,954 |
3,534 |
1,966 |
||||
|
19 |
Kadiri ... ... ... |
1 |
2,324 |
1,799 |
4,123 |
4,123 |
3,684 |
2,043 |
||||
|
20 |
Kalyāndrug ... ... |
1 |
1,726 |
1,454 |
3,180 |
3,180 |
2,928 |
1,446 |
||||
|
21 |
Madakasīra ... ... |
1 |
2,202 |
1,829 |
4,031 |
4,031 |
3,261 |
1,495 |
||||
|
22 |
Penukonda ... ... |
1 |
1,677 |
1,525 |
3,202 |
3,202 |
3,068 |
1,906 |
||||
|
23 |
Tādpatri ... ... |
2 |
2,065 |
1,489 |
3,564 |
1,782 |
3,207 |
1,427 |
||||
|
24 |
Tanakal ... ... |
1 |
1,377 |
1,072 |
2,449 |
2,449 |
2,223 |
1,236 |
||||
|
25 |
Uravakonda ... ... |
1 |
1,666 |
1,304 |
2,970 |
2,970 |
2,570 |
1,385 |
||||
|
... |
Reserve vaccinators ... |
3 |
... |
... |
... |
... |
... |
|||||
|
... |
... |
Total of district ... |
920,716 |
137 |
18 |
20,718 |
16,179 |
36,897 |
2,050 |
32,650 |
17,785 |
|
|
26 |
Arcot (North). |
Arkōnam ... ... |
1,914,291 |
389 |
2 |
3,614 |
3,042 |
6,656 |
3,328 |
5,594 |
3,255 |
|
|
27 |
ārni ... ... ... |
2 |
3,192 |
2,593 |
5,795 |
2,892 |
4,844 |
3,716 |
||||
|
28 |
Chengam ... ... |
2 |
2,917 |
2,287 |
5,204 |
2,602 |
4,532 |
2,539 |
||||
|
29 |
Cheyyār... ... ... |
2 |
3,522 |
3,057 |
6,579 |
3,289 |
5,963 |
3,463 |
||||
|
30 |
Gudiyātlam ... ... |
2 |
4,427 |
3,684 |
8,111 |
4,055 |
7,396 |
3,921 |
||||
|
31 |
Polur ... ... ... |
2 |
4,536 |
3,672 |
8,208 |
4,104 |
6,761 |
3,610 |
||||
|
32 |
Rānipet ... ... ... |
2 |
4,736 |
3,810 |
8,546 |
4,273 |
7,275 |
4,276 |
||||
|
33 |
Tiruppattūr ... ... |
3 |
5,669 |
4,848 |
10,517 |
3,506 |
9,476 |
5,494 |
||||
|
34 |
Tiruvannāmalai ... |
2 |
4,732 |
3,546 |
8,278 |
4,139 |
6,786 |
3,131 |
||||
|
35 |
Vellore ... ... ... |
2 |
4,319 |
3,939 |
8,258 |
4,128 |
7,343 |
4,855 |
||||
|
36 |
Wandiwash ... ... |
2 |
3,904 |
3,190 |
7,094 |
3,547 |
5,991 |
2,485 |
||||
|
... |
Reserve vaccinators ... |
1 |
... |
... |
... |
... |
... |
|||||
|
... |
Total of district ... |
1,914,291 |
389 |
24 |
45,568 |
37,668 |
83,236 |
3,468 |
71,961 |
40,745 |
||
|
37 |
Arcot (South). |
Chidambaram ... ... |
2,229,634 |
530 |
2 |
3,549 |
2,704 |
6,253 |
3,127 |
4,889 |
2,873 |
|
|
38 |
Cuddalore (South) ... |
1 |
2,876 |
2,822 |
5,698 |
5,698 |
5,422 |
2,631 |
||||
|
39 |
Cuddalore (North) ... |
2 |
3,698 |
3,437 |
7,135 |
3,568 |
6,626 |
2,888 |
||||
|
40 |
Gingee ... ... ... |
2 |
4,290 |
3,032 |
7,322 |
3,661 |
5,670 |
2,752 |
||||
|
41 |
Kallakurchi ... ... |
2 |
2,866 |
2,481 |
5,347 |
2,674 |
5,149 |
2,292 |
||||
|
42 |
Kattumannarkoil ... |
1 |
2,252 |
1,999 |
4,251 |
4,251 |
3,842 |
2,120 |
||||
|
43 |
Tindivanam ... ... |
2 |
4,328 |
2,805 |
7,133 |
3,567 |
5,835 |
2,649 |
||||
|
44 |
Tirukkōyilūr ... ... |
2 |
4,461 |
2,953 |
7,414 |
3,707 |
5,706 |
2,527 |
||||
|
45 |
Tittagudi ... ... |
1 |
2,556 |
2,302 |
4,858 |
4,858 |
4,710 |
2,006 |
||||
|
46 |
Ulundūrpet ... ... |
2 |
3,020 |
2,489 |
5,509 |
2,755 |
4,913 |
2,621 |
||||
|
47 |
Villupuram ... ... |
2 |
4,831 |
3,514 |
8,345 |
4,173 |
7,157 |
3,493 |
||||
|
48 |
Vriddhāchalam ... |
1 |
1,925 |
1,701 |
3,626 |
3,626 |
3,398 |
1,553 |
||||
|
... |
Reserve vaccinators ... |
2 |
... |
... |
... |
... |
... |
... |
||||
|
Total of district ... |
2,229,634 |
530 |
22 |
40,652 |
32,239 |
72,891 |
3,313 |
63,317 |
30,805 |
|||
Set display mode to: Large image | Zoom image | Transcription
Images and transcriptions on this page, including medium image downloads, may be used under the Creative Commons Attribution 4.0 International Licence unless otherwise stated. ![]()
| Permanent URL | https://digital.nls.uk/91181156 |
|---|
| Attribution and copyright: |
|
|---|


