

Medicine - Vaccination > 1877-1929 - Report on vaccination in the Madras Presidency > Report on vaccination in Madras 1922-1929 > 1923-1924 - Report on vaccination in the Madras Presidency for the year 1923-24
(135) Page 7
Download files
Individual page:
Thumbnail gallery: Grid view | List view
7
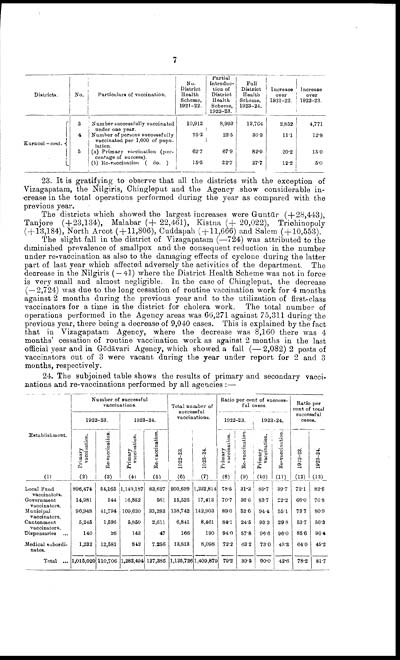
|
Districts. |
No. |
Particulars of vaccination. |
No. |
Partial |
Full |
Increase |
Increase |
|
Kurnool —cont. |
3 |
Number successfully vaccinated |
10,912 |
8,993 |
13,764 |
2,852 |
4,771 |
|
4 |
Number of persons successfully |
25.2 |
23.5 |
36.3 |
11.1 |
12.8 |
|
|
5 |
(a) Primary vaccination (per- |
62.7 |
67.9 |
82.9 |
20.2 |
15.0 |
|
|
(b) Re-vaccination ( do. ) |
15.5 |
22.7 |
27.7 |
12.2 |
5.0 |
23. It is gratifying to observe that all the districts with the exception of
Vizagapatam, the Nilgiris, Chingleput and the Agency show considerable in-
crease in the total operations performed during the year as compared with the
previous year.
The districts which showed the largest increases were Guntūr (+28,443),
Tanjore (+23,134), Malabar (+ 22,461), Kistna (+ 20,022), Trichinopoly
( + 13,184), North Arcot ( + 11,806), Cuddapah ( + 11,666) and Salem (+10,553).
The slight fall in the district of Vizagapatam (—724) was attributed to the
diminished prevalence of smallpox and the consequent reduction in the number
under re-vaccination as also to the damaging effects of cyclone during the latter
part of last year which affected adversely the activities of the department. The
decrease in the Nilgiris ( — 41) where the District Health Scheme was not in force
is very small and almost negligible. In the case of Chingleput, the decrease
( — 2,724) was due to the long cessation of routine vaccination work for 4 months
against 2 months during the previous year and to the utilization of first-class
vaccinators for a time in the district for cholera work. The total number of
operations performed in the Agency areas was 66,271 against 75,311 during the
previous year, there being a decrease of 9,040 cases. This is explained by the fact
that in Vizagapatam Agency, where the decrease was 8,160 there was 4
months' cessation of routine vaccination work as against 2 months in the last
official year and in Gōdāvari Agency, which showed a fall (— 2,082) 2 posts of
vaccinators out of 3 were vacant during the year under report for 2 and 3
months, respectively.
24. The subjoined table shows the results of primary and secondary vacci-
nations and re-vaccinations performed by all agencies :—
|
Establishment. |
Number of successful |
Total number of |
Ratio per cent of success- |
Ratio per |
||||||||
|
1922-23. |
1923-24. |
1922-23. |
1923-24. |
|||||||||
|
Primary |
Re-vaccination. |
Primary |
Re-vaccination. |
1922-23. |
1923-24. |
Primary |
Primary |
Re-vaccination. |
1922-23. |
1923-24. |
||
|
(1) |
(2) |
(3) |
(4) |
(5) |
(6) |
(7) |
(8) |
(9) |
(10) |
(11) |
(12) |
(13) |
|
Local Fund |
896,474 |
54,165 |
1,149,187 |
83,627 |
950,639 |
1,232,814 |
78.5 |
31.3 |
89.7 |
39.7 |
72.1 |
82.6 |
|
Government |
14,981 |
544 |
16,852 |
561 |
15,525 |
17,413 |
70.7 |
36.6 |
83.7 |
22.2 |
66.0 |
76.8 |
|
Municipal |
96,948 |
41,794 |
109,620 |
33,283 |
138,742 |
142,903 |
89.0 |
52.6 |
94.4 |
55.1 |
73.7 |
80.9 |
|
Cantonment |
5,245 |
1,596 |
5,850 |
2,611 |
6,841 |
8,461 |
84.1 |
24.5 |
93.3 |
29.8 |
53.7 |
56.3 |
|
Dispensaries ... |
140 |
26 |
143 |
47 |
166 |
190 |
94.0 |
57.8 |
96.6 |
96.0 |
85.6 |
96.4 |
|
Medical subordi- |
1,232 |
12,581 |
842 |
7,256 |
13,813 |
8,098 |
72.2 |
63.2 |
73.0 |
43.3 |
64.0 |
45.2 |
|
Total ... |
1,015,020 |
110,706 |
1,282,494 |
127,385 |
1,125,726 |
1,409,879 |
79.2 |
39.5 |
90.0 |
42.6 |
78.2 |
81.7 |
Set display mode to: Large image | Zoom image | Transcription
Images and transcriptions on this page, including medium image downloads, may be used under the Creative Commons Attribution 4.0 International Licence unless otherwise stated. ![]()
| Permanent URL | https://digital.nls.uk/91180160 |
|---|
| Attribution and copyright: |
|
|---|
| Description | Covers 1877-1929. Details and appraises vaccination operations in the Madras Presidency. Describes manufacture and storage of lymph. Tables show particulars of vaccination. Success and mortality rates noted. Graphs included. |
|---|---|
| Shelfmark | IP/25/VA.3 |
| Additional NLS resources: | |
| Description | The Vaccination collection consists of 66 volumes dating from 1856 to 1933. Reports show how vaccination against smallpox was implemented in India. They reveal the shift from variolation, improved vaccination techniques, logistics of lymph supply, funding and staffing. They explore how the local population viewed and resisted western vaccination. |
|---|---|
| Description | The India Papers collection contains publications of the central (Imperial) Government and many Indian states. Most states came under British rule. Much of the collection dates from between the post-Mutiny re-organisation of the Indian Government and Indian Independence in 1947. Some items published in London by John Murray. |
|---|---|
| Shelfmark | India Papers |
| Additional NLS resources: | |