

Medicine - Vaccination > 1877-1929 - Report on vaccination in the Madras Presidency > Report on vaccination in Madras 1922-1929 > 1921-1922 - Annual report on vaccination in the Madras Presidency for the year 1921-22
(12) Page 4
Download files
Individual page:
Thumbnail gallery: Grid view | List view
4
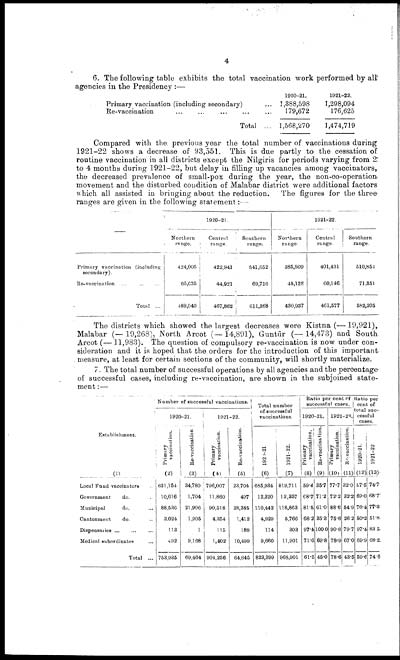
6. The following table exhibits the total vaccination work performed by all
agencies in the Presidency :—
|
1920-21. |
1921-22. |
|
|
Primary vaccination (including secondary) ... |
2,388,598 |
1,298,094 |
|
Re-vaccination ... ... ... ... ... |
179,672 |
176,625 |
|
Total ... |
1,568,270 |
1,474,719 |
Compared with the. previous year the total number of vaccinations during
1921-22 shows a decrease of 93,551. This is due partly to the cessation of
routine vaccination in all districts except the Nilgiris for periods varying from 2
to 4 months during 1921-22, but delay in filling up vacancies among vaccinators,
the decreased prevalence of small-pox during the year, the non-co-operation
movement and the disturbed condition of Malabar district were additional factors
which all assisted in bringing about the reduction. The figures for the three
ranges are given in the following statement:—
|
— |
1920-21. |
1921-22. |
||||
|
Northern |
Centra1 |
Southern |
Northern |
Central |
Southern |
|
|
Primary vaccination (including |
424,005 |
422,941 |
541,652 |
385,809 |
401,431 |
510,854 |
|
Re-vaccination ... ... ... |
65,035 |
44,921 |
69,716 |
45,128 |
60,146 |
71,351 |
|
Total ... |
489,040 |
467,862 |
611,368 |
430,937 |
461,577 |
582,205 |
The districts which showed the largest decreases were Kistna (—19,921),
Malabar (—19,268), North Arcot (—14,891), Guntūr (—14,473) and South.
Arcot (—11,983). The question of compulsory re-vaccination is now under con-
sideration and it is hoped that the orders for the introduction of this important
measure, at least for certain sections of the community, will shortly materialize.
7. The total number of successful operations by all agencies and the percentage
of successful cases, including re-vaccination, are shown in the subjoined state-
ment :—
|
Establishment. |
Number of successful vaccinations. |
Total number |
Ratio per cent of |
Ratio per |
||||||||
|
1920-21. |
1921-22. |
1920-21. |
1921-29. |
|||||||||
|
Primary |
Re-vaccination |
Primary |
Re-vaccination. |
1921-21 |
1921-22 |
Primary |
Re-vaccination. |
Primary |
Re-vaccination. |
1920-21. |
1921-22 |
|
|
(1) |
(2) |
(3) |
(4) |
(5) |
(6) |
(7) |
(8) |
(9) |
(10) |
(11) |
(12) |
(13) |
|
Local Fund vaccinators ... |
651,154 |
34,780 |
796,007 |
23,704 |
685,934 |
819,711 |
59.4 |
35.7 |
77.7 |
32.0 |
57.5 |
74.7 |
|
Government do. ... |
10,616 |
1,704 |
11,860 |
497 |
12,320 |
12,357 |
68.7 |
71.2 |
72.2 |
32.2 |
69.0 |
68.7 |
|
Municipal do. ... |
88,536 |
21,906 |
90,518 |
28,345 |
110,442 |
118,863 |
81.5 |
61.0 |
88.6 |
54.9 |
76.4 |
77.3 |
|
Cantonment do. ... |
3,024 |
1,905 |
4,354 |
1,412 |
4,929 |
5,766 |
68.2 |
35.3 |
75.6 |
26.2 |
50.2 |
51.8 |
|
Dispensaries ... ... ... |
113 |
1 |
115 |
188 |
114 |
303 |
97.4 |
100.0 |
90.6 |
79.7 |
97.4 |
83.5 |
|
Medical subordinates ... |
492 |
9,168 |
1,402 |
10,499 |
9,660 |
11,901 |
71.6 |
69.8 |
78.9 |
67.0 |
69.9 |
68.2 |
|
Total ... |
753,935 |
69,464 |
904,256 |
64,645 |
823,399 |
968,901 |
61.5 |
45.0 |
78.6 |
43.5 |
59.6 |
74.6 |
Set display mode to: Large image | Zoom image | Transcription
Images and transcriptions on this page, including medium image downloads, may be used under the Creative Commons Attribution 4.0 International Licence unless otherwise stated. ![]()
| Permanent URL | https://digital.nls.uk/91179790 |
|---|
| Attribution and copyright: |
|
|---|
| Description | Covers 1877-1929. Details and appraises vaccination operations in the Madras Presidency. Describes manufacture and storage of lymph. Tables show particulars of vaccination. Success and mortality rates noted. Graphs included. |
|---|---|
| Shelfmark | IP/25/VA.3 |
| Additional NLS resources: | |
| Description | The Vaccination collection consists of 66 volumes dating from 1856 to 1933. Reports show how vaccination against smallpox was implemented in India. They reveal the shift from variolation, improved vaccination techniques, logistics of lymph supply, funding and staffing. They explore how the local population viewed and resisted western vaccination. |
|---|---|
| Description | The India Papers collection contains publications of the central (Imperial) Government and many Indian states. Most states came under British rule. Much of the collection dates from between the post-Mutiny re-organisation of the Indian Government and Indian Independence in 1947. Some items published in London by John Murray. |
|---|---|
| Shelfmark | India Papers |
| Additional NLS resources: | |