

Medicine - Vaccination > 1877-1929 - Report on vaccination in the Madras Presidency > Report on vaccination in Madras 1904-1921 > 1920-1921 - Annual report on vaccination in the Madras Presidency for the year 1920-21
(581) Page 10
Download files
Individual page:
Thumbnail gallery: Grid view | List view
10
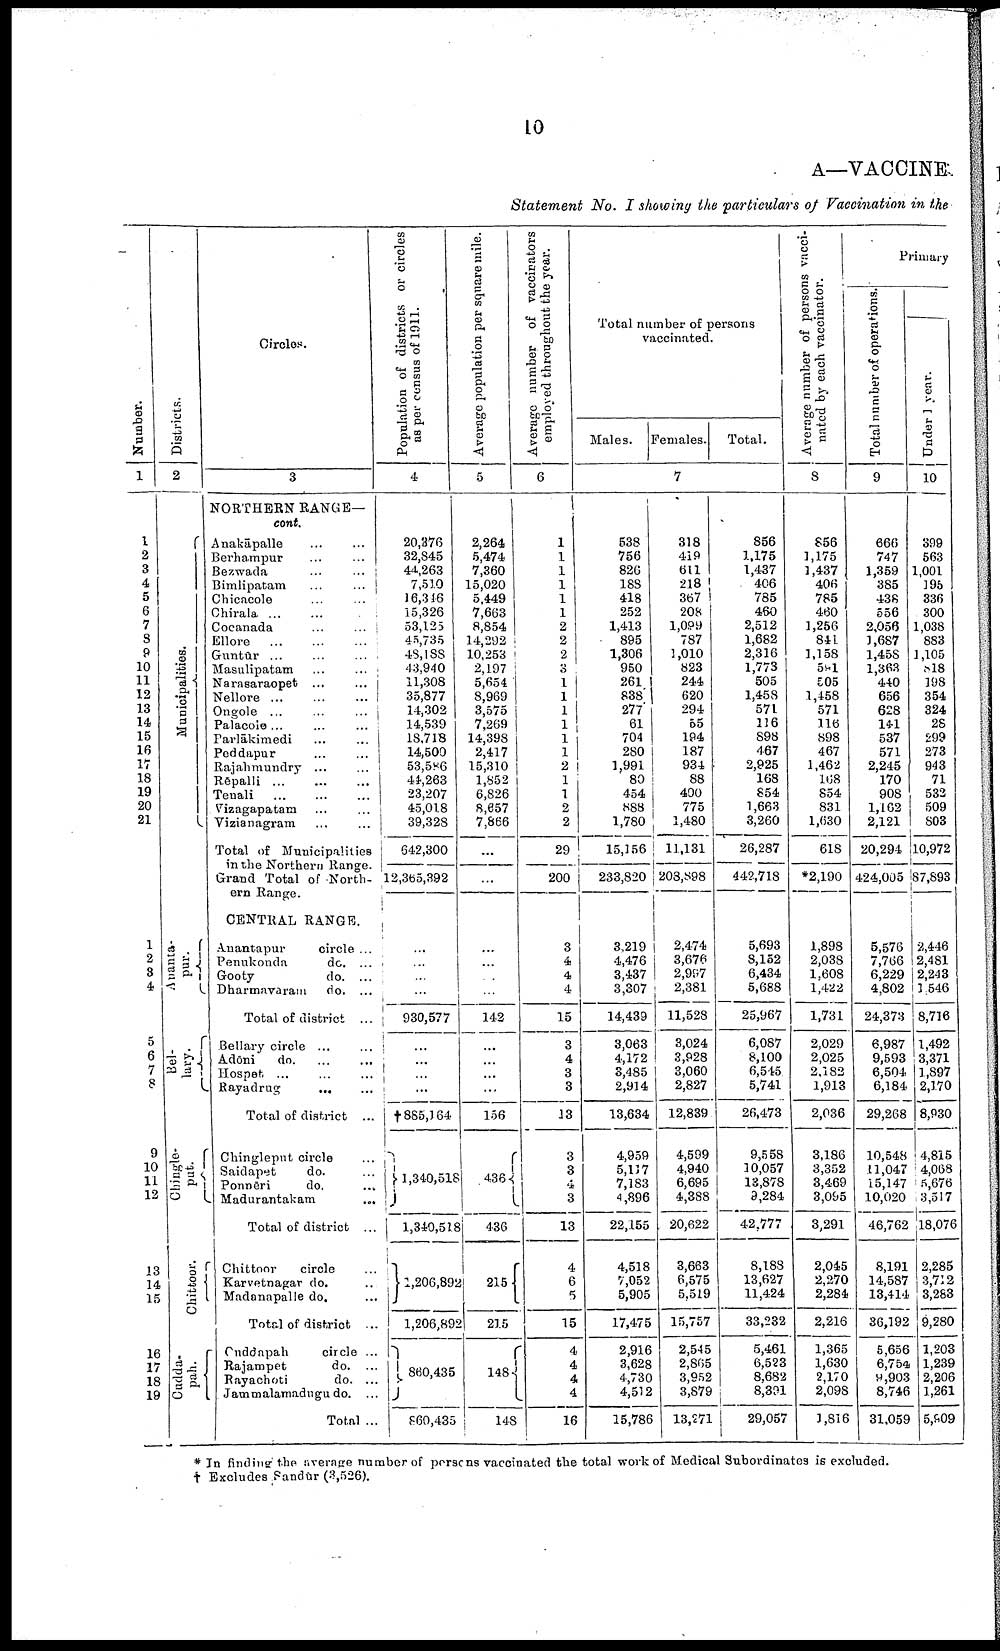
A—VACCINE.
Statement No. I showing the particulars of Vaccination in the
|
Number. |
Districts. |
Circles. |
Population of districts or circles |
Average population per square mile. |
Average number of vaccinators |
Total number of persons |
Average number of persons vacci- |
Primary |
|||
|
Total number of operations. |
Under 1 year. |
||||||||||
|
Males. |
Females. |
Total. |
|||||||||
|
1 |
2 |
3 |
4 |
5 |
6 |
7 |
8 |
9 |
10 |
||
|
NORTHERN RANGE— |
|||||||||||
|
1 |
Municipalities. |
Anakāpalle ... ... |
20,376 |
2,264 |
1 |
538 |
318 |
856 |
856 |
666 |
399 |
|
2 |
Berhampur ... ... |
32,845 |
5,474 |
1 |
756 |
419 |
1,175 |
1,175 |
747 |
563 |
|
|
3 |
Bezwada ... ... |
44,263 |
7,360 |
1 |
826 |
611 |
1,437 |
1,437 |
1,359 |
1,001 |
|
|
4 |
Bimlipatam ... ... |
7,510 |
15,020 |
1 |
188 |
218 |
406 |
406 |
385 |
195 |
|
|
5 |
Chicacole ... ... |
16,316 |
5,449 |
1 |
418 |
367 |
785 |
785 |
438 |
336 |
|
|
6 |
Chirala ... ... ... |
15,326 |
7,663 |
1 |
252 |
208 |
460 |
460 |
556 |
300 |
|
|
7 |
Cocanada ... ... |
53,125 |
8,854 |
2 |
1,413 |
1,099 |
2,512 |
1,256 |
2,056 |
1,038 |
|
|
8 |
Ellore ... ... ... |
45,735 |
14,292 |
2 |
895 |
787 |
1,682 |
841 |
1,687 |
883 |
|
|
9 |
Guntūr ... ... ... |
48,188 |
10,253 |
2 |
1,306 |
1,010 |
2,316 |
1,158 |
1,458 |
1,105 |
|
|
10 |
Masulipatam ... ... |
43,940 |
2,197 |
3 |
950 |
823 |
1,773 |
591 |
1,363 |
818 |
|
|
11 |
Narasaraopet ... ... |
11,308 |
5,654 |
1 |
261 |
244 |
505 |
505 |
440 |
198 |
|
|
12 |
Nellore ... ... ... |
35,877 |
8,969 |
1 |
838 |
620 |
1,458 |
1,458 |
656 |
354 |
|
|
13 |
Ongole ... ... ... |
14,302 |
3,575 |
1 |
277 |
294 |
571 |
571 |
628 |
324 |
|
|
14 |
Palacole... ... ... |
14,539 |
7,269 |
1 |
61 |
55 |
116 |
116 |
141 |
28 |
|
|
15 |
Parlākimedi ... ... |
18,718 |
14,398 |
1 |
704 |
194 |
898 |
898 |
537 |
299 |
|
|
16 |
Peddapur ... ... |
14,500 |
2,417 |
1 |
280 |
187 |
467 |
467 |
571 |
273 |
|
|
17 |
Rajahmundry ... ... |
53,586 |
15,310 |
2 |
1,991 |
934 |
2,925 |
1,462 |
2,245 |
943 |
|
|
18 |
Rēpalli ... ... ... |
44,263 |
1,852 |
1 |
80 |
88 |
168 |
168 |
170 |
71 |
|
|
19 |
Tenali ... ... ... |
23,207 |
6,826 |
1 |
454 |
400 |
854 |
854 |
908 |
532 |
|
|
20 |
Vizagapatam ... ... |
45,018 |
8,657 |
2 |
888 |
775 |
1,663 |
831 |
1,162 |
509 |
|
|
21 |
Vizianagram ... ... |
39,328 |
7,866 |
2 |
1,780 |
1,480 |
3,260 |
1,630 |
2,121 |
803 |
|
|
Total of Municipalities |
642,300 |
... |
29 |
15,156 |
11,131 |
26,287 |
618 |
20,294 |
10,972 |
||
|
12,365,392 |
... |
200 |
233,820 |
208,898 |
442,718 |
*2,190 |
424,005 |
87,893 |
|||
|
CENTRAL RANGE. |
|||||||||||
|
1 |
Atlanta- |
Anantapur circle ... |
... |
... |
3 |
3,219 |
2,474 |
5,693 |
1,898 |
5,576 |
2,446 |
|
2 |
Penukonda do. ... |
... |
... |
4 |
4,476 |
3,676 |
8,152 |
2,038 |
7,766 |
2,481 |
|
|
8 |
Gooty do. ... |
... |
... |
4 |
3,437 |
2,997 |
6,434 |
1,608 |
6,229 |
2,243 |
|
|
4 |
Dharmayaram do. ... |
... |
... |
4 |
3,307 |
2,381 |
5,688 |
1,422 |
4,802 |
1,546 |
|
|
Total of district ... |
930,577 |
142 |
15 |
14,439 |
11,528 |
25,967 |
1,731 |
24,373 |
8,716 |
||
|
5 |
Bel- |
Bellary circle ... ... |
... |
... |
3 |
3,063 |
3,024 |
6,087 |
2,029 |
6,987 |
1,492 |
|
6 |
Adōni do. ... ... . |
... |
... |
4 |
4,172 |
3,928 |
8,100 |
2,025 |
9,593 |
3,371 |
|
|
7 |
Hospet ... ... ... |
... |
... |
3 |
3,485 |
3,060 |
6,545 |
2,182 |
6,504 |
1,897 |
|
|
8 |
Rayadrug ... ... |
... |
... |
3 |
2,914 |
2,827 |
5,741 |
1,913 |
6,184 |
2,170 |
|
|
Total of district ... |
†885,164 |
156 |
13 |
13,634 |
12,839 |
26,473 |
2,036 |
29,268 |
8,930 |
||
|
9 |
Chingle- |
Chinglepnt circle ... |
1,340,518 |
436 |
3 |
4,959 |
4,599 |
9,558 |
3,186 |
10,548 |
4,815 |
|
10 |
Saidapet do. ... |
3 |
5,117 |
4,940 |
10,057 |
3,352 |
11,047 |
4,068 |
|||
|
11 |
Ponnēri do. ... |
4 |
7,183 |
6,695 |
18,878 |
3,469 |
15,147 |
5,676 |
|||
|
12 |
Madurantakam ... |
3 |
4,896 |
4,388 |
9,284 |
3,095 |
10,020 |
3,517 |
|||
|
Total of district ... |
1,340,518 |
436 |
13 |
22,155 |
20,622 |
42.777 |
3,291 |
46,762 |
18,076 |
||
|
13 |
Chittoor. |
Chittoor circle ... |
1,206,892 |
215 |
4 |
4,518 |
3,663 |
8,188 |
2,045 |
8,191 |
2,285 |
|
14 |
Karvetnagar do. ... |
6 |
7,052 |
6,675 |
13,627 |
2,270 |
14,587 |
3,712 |
|||
|
15 |
Madanapalle do. ... |
5 |
5,905 |
5,519 |
11,424 |
2,284 |
13,414 |
3,283 |
|||
|
Total of district ... |
1,206,892 |
215 |
15 |
17,475 |
15,757 |
33,232 |
2,216 |
36,192 |
9,280 |
||
|
16 |
Cudda- |
Cuddapah circle ... |
860,435 |
148 |
4 |
2,916 |
2,545 |
5,461 |
1,365 |
5,656 |
1,203 |
|
17 |
Rajampet do. ... |
4 |
3,628 |
2,865 |
6,523 |
1,630 |
6,754 |
1,239 |
|||
|
18 |
Rayachoti do. ... |
4 |
4,730 |
3,952 |
8,682 |
2,170 |
9,903 |
2,206 |
|||
|
19 |
Jammalamadugu do. ... |
4 |
4,512 |
3,879 |
8,391 |
2,098 |
8,746 |
1,261 |
|||
|
Total ... |
860,435 |
148 |
16 |
15,786 |
13,271 |
29,057 |
1,816 |
31,059 |
5,909 |
||
* In finding the average number of persons vaccinated the total work of Medical Subordinates is excluded.
† Excludes Sandūr (3,526).
Set display mode to: Large image | Zoom image | Transcription
Images and transcriptions on this page, including medium image downloads, may be used under the Creative Commons Attribution 4.0 International Licence unless otherwise stated. ![]()
| Permanent URL | https://digital.nls.uk/91179630 |
|---|
| Attribution and copyright: |
|
|---|---|
| Description | Covers 1877-1929. Details and appraises vaccination operations in the Madras Presidency. Describes manufacture and storage of lymph. Tables show particulars of vaccination. Success and mortality rates noted. Graphs included. |
|---|---|
| Shelfmark | IP/25/VA.3 |
| Additional NLS resources: | |
| Description | The Vaccination collection consists of 66 volumes dating from 1856 to 1933. Reports show how vaccination against smallpox was implemented in India. They reveal the shift from variolation, improved vaccination techniques, logistics of lymph supply, funding and staffing. They explore how the local population viewed and resisted western vaccination. |
|---|---|
| Description | The India Papers collection contains publications of the central (Imperial) Government and many Indian states. Most states came under British rule. Much of the collection dates from between the post-Mutiny re-organisation of the Indian Government and Indian Independence in 1947. Some items published in London by John Murray. |
|---|---|
| Shelfmark | India Papers |
| Additional NLS resources: | |