

Medicine - Vaccination > 1877-1929 - Report on vaccination in the Madras Presidency > Report on vaccination in Madras 1904-1921 > 1919-1920 - Annual report on vaccination in the Madras Presidency for the year 1919-20
(526) Page 6
Download files
Individual page:
Thumbnail gallery: Grid view | List view

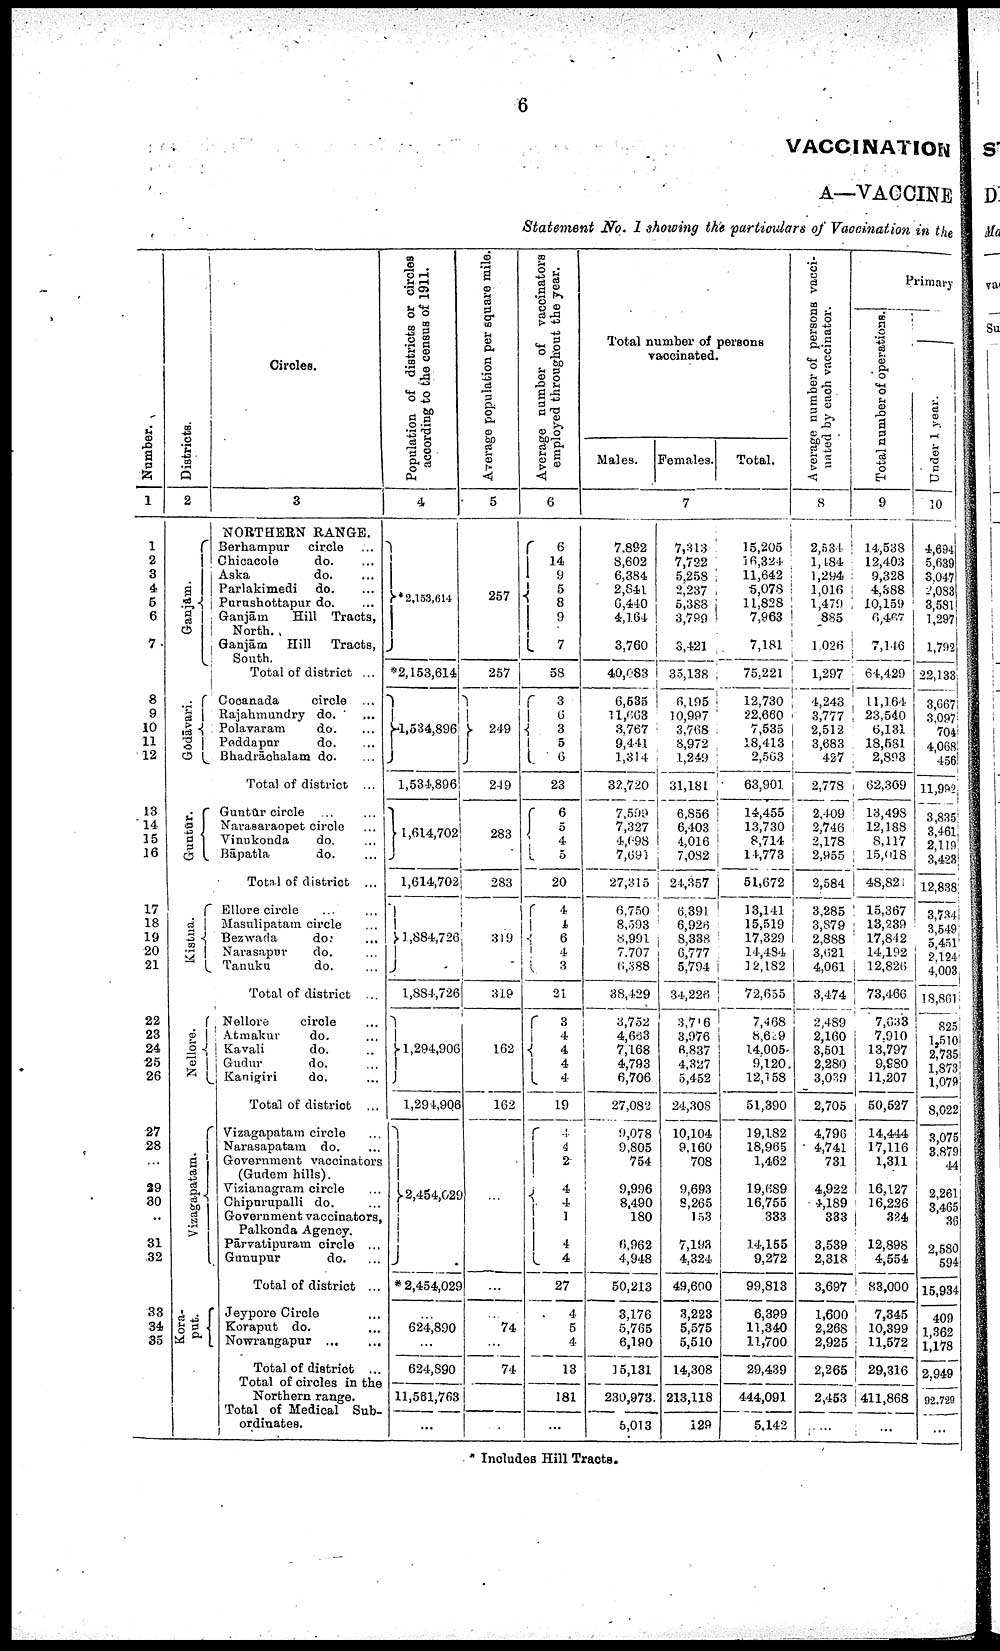
6
VACCINATION
A—VACCINE
Statement No. I showing the particulars of Vaccination in the
|
Number. |
Districts. |
Circles. |
Population of districts or circles |
Average population per square mile. |
Average number of vaccinators |
Total number of persons |
Average number of persons vacci- |
Primary |
|||
|
Total number of operations. |
|||||||||||
|
Under 1 year. |
|||||||||||
|
Males. |
Females. |
Total. |
|||||||||
|
1 |
2 |
3 |
4 |
5 |
6 |
7 |
8 |
9 |
10 |
||
|
NORTHERN RANGE. |
|||||||||||
|
1 |
Gānjam. |
Berhampur circle ... |
2,153,614 |
257 |
6 |
7,892 |
7,313 |
15,205 |
2,534 |
14,538 |
4,694 |
|
2 |
Chicacole do. ... |
14 |
8,602 |
7,722 |
16,324 |
1,184 |
12,403 |
5,639 |
|||
|
3 |
Aska do. ... |
9 |
6,384 |
5,258 |
11,642 |
1,294 |
9,328 |
3,047 |
|||
|
4 |
Parlakimedi do. ... |
5 |
2,841 |
2,237 |
5,078 |
1,016 |
4,388 |
2,083 |
|||
|
5 |
Purushottapur do. ... |
8 |
6,440 |
5,388 |
11,828 |
1,479 |
10,159 |
3,581 |
|||
|
6 |
Ganjām Hill Tracts, |
9 |
4,164 |
3,789 |
7,963 |
885 |
6,467 |
1,297 |
|||
|
7 |
Ganjām Hill Tracts, |
7 |
3,760 |
3,421 |
7,181 |
1,026 |
7,146 |
1,792 |
|||
|
Total of district ... |
*2,153,614 |
257 |
58 |
40,083 |
35,138 |
75,221 |
1,297 |
64,429 |
22,133 |
||
|
8 |
Gōdāvari. |
Cocanada circle ... |
1,534,896 |
249 |
3 |
6,535 |
6,195 |
12,730 |
4,243 |
11,164 |
3,667 |
|
9 |
Rajahmundry do. ... |
6 |
11,663 |
10,997 |
22,660 |
3,777 |
23,540 |
3,097 |
|||
|
10 |
Polavaram do. ... |
3 |
3,767 |
3,768 |
7,535 |
2,512 |
6,131 |
704 |
|||
|
11 |
Peddapur do. ... |
5 |
9,441 |
8,972 |
18,413 |
3,683 |
18,581 |
4,068 |
|||
|
12 |
Bhadrāchalam do. ... |
6 |
1,314 |
1,249 |
2,563 |
427 |
2,893 |
456 |
|||
|
Total of district ... |
1,534,896 |
249 |
23 |
32,720 |
31,181 |
63,901 |
2,778 |
62,369 |
11,992 |
||
|
13 |
Guntūr. |
Guntūr circle ... ... |
1,614,702 |
283 |
6 |
7,599 |
6,856 |
14,455 |
2,409 |
13,498 |
3,835 |
|
14 |
Narasaraopet circle ... |
5 |
7,327 |
6,403 |
13,730 |
2,746 |
12,188 |
3,461 |
|||
|
15 |
Vinukonda do. ... |
4 |
4,698 |
4,016 |
8,714 |
2,178 |
8,117 |
2,119 |
|||
|
16 |
Bāpatla do. ... |
5 |
7,691 |
7,082 |
14,773 |
2,955 |
15,018 |
3,423 |
|||
|
Total of district ... |
1,614,702 |
283 |
20 |
27,315 |
24,357 |
51,672 |
2,584 |
48,821 |
12,838 |
||
|
17 |
Kistna. |
Ellore circle ... ... |
1,884,726 |
319 |
4 |
6,750 |
6,391 |
13,141 |
3,285 |
15,367 |
3,734 |
|
18 |
Masulipatam circle ... |
4 |
8,593 |
6,926 |
15,519 |
3,879 |
13,239 |
3,549 |
|||
|
19 |
Bezwada do. ... |
6 |
8,991 |
8,338 |
17,329 |
2,888 |
17,842 |
... |
|||
|
20 |
Narasapur do. ... |
4 |
7,707 |
6,777 |
14,484 |
3,621 |
14,192 |
2,124 |
|||
|
21 |
Tanuku do. ... |
3 |
6,388 |
5,794 |
12,182 |
4,061 |
12,826 |
4,003 |
|||
|
Total of district ... |
1,884,726 |
319 |
21 |
38,429 |
34,226 |
72,655 |
3,474 |
73,466 |
18,861 |
||
|
22 |
Nellore. |
Nellore circle ... |
1,294,906 |
162 |
3 |
3,752 |
3,716 |
7,468 |
2,489 |
7,633 |
825 |
|
23 |
Atmakur do. ... |
4 |
4,663 |
3,976 |
8,619 |
2,160 |
7,910 |
1,510 |
|||
|
24 |
Kavali do. ... |
4 |
7,168 |
6,837 |
14,005 |
3,501 |
13,797 |
2,735 |
|||
|
25 |
Gudur do. ... |
4 |
4,793 |
4,327 |
9,120 |
2,280 |
9,980 |
1,873 |
|||
|
26 |
Kanigiri do. ... |
4 |
6,706 |
5,452 |
12,158 |
3,039 |
11,207 |
l,079 |
|||
|
Total of district ... |
1,294,906 |
162 |
19 |
27,082 |
24,308 |
51,390 |
2,705 |
50,527 |
8,022 |
||
|
27 |
Vizagapatam. |
Vizagapatam circle ... |
2,454,029 |
... |
4 |
9,078 |
10,104 |
19,182 |
4,796 |
14,444 |
3,075 |
|
28 |
Narasapatam do. ... |
4 |
9,805 |
9,160 |
18,965 |
4,741 |
17,116 |
3,879 |
|||
|
... |
Government vaccinators |
2 |
754 |
708 |
1,462 |
731 |
1,311 |
44 |
|||
|
29 |
Vizianagram circle ... |
4 |
9,996 |
9,693 |
19,689 |
4,922 |
16,127 |
2,261 |
|||
|
30 |
Chipurupalli do. ... |
4 |
8,490 |
8,265 |
16,755 |
4,189 |
16,226 |
3,465 |
|||
|
... |
Government vaccinators, |
1 |
180 |
153 |
333 |
333 |
324 |
36 |
|||
|
31 |
Pārvatipuram circle ... |
4 |
6,962 |
7,193 |
14,155 |
3,539 |
12,898 |
2,580 |
|||
|
32 |
Gunupur do. ... |
4 |
4,948 |
4,324 |
9,272 |
2,318 |
4,554 |
594 |
|||
|
Total of district ... |
*2,454,029 |
... |
27 |
50,213 |
49,600 |
99,813 |
3,697 |
83,000 |
15,934 |
||
|
33 |
Kora- |
Jeypore Circle ... |
... |
... |
4 |
3,176 |
3,223 |
6,399 |
1,600 |
7,345 |
409 |
|
34 |
Koraput do. ... |
624,890 |
74 |
5 |
5,765 |
5,575 |
11,340 |
2,268 |
10,399 |
1,362 |
|
|
35 |
Nowrangapur ... ... |
... |
... |
4 |
6,190 |
5,510 |
11,700 |
2,925 |
11,572 |
1,178 |
|
|
Total of district ... |
624,890 |
74 |
13 |
15,131 |
14,308 |
29,439 |
2,265 |
29,316 |
2,949 |
||
|
Total of circles in the |
11,581,763 |
... |
181 |
230,973 |
213,118 |
444,091 |
2,453 |
411,868 |
92,729 |
||
|
Total of Medical Sub- |
... |
... |
... |
5,013 |
129 |
5,142 |
... |
... |
... |
||
* Includes Hill Tracts.
Set display mode to: Large image | Zoom image | Transcription
Images and transcriptions on this page, including medium image downloads, may be used under the Creative Commons Attribution 4.0 International Licence unless otherwise stated. ![]()
| Permanent URL | https://digital.nls.uk/91179459 |
|---|
| Attribution and copyright: |
|
|---|---|
| Description | Covers 1877-1929. Details and appraises vaccination operations in the Madras Presidency. Describes manufacture and storage of lymph. Tables show particulars of vaccination. Success and mortality rates noted. Graphs included. |
|---|---|
| Shelfmark | IP/25/VA.3 |
| Additional NLS resources: | |
| Description | The Vaccination collection consists of 66 volumes dating from 1856 to 1933. Reports show how vaccination against smallpox was implemented in India. They reveal the shift from variolation, improved vaccination techniques, logistics of lymph supply, funding and staffing. They explore how the local population viewed and resisted western vaccination. |
|---|---|
| Description | The India Papers collection contains publications of the central (Imperial) Government and many Indian states. Most states came under British rule. Much of the collection dates from between the post-Mutiny re-organisation of the Indian Government and Indian Independence in 1947. Some items published in London by John Murray. |
|---|---|
| Shelfmark | India Papers |
| Additional NLS resources: | |