

Medicine - Vaccination > 1877-1929 - Report on vaccination in the Madras Presidency > Report on vaccination in Madras 1904-1921 > 1918-1919 - Annual report on the vaccination in the Madras Presidency and also on the work of the vaccine section of the King Institute of Preventive Medicine, Madras for the year 1918-19
(453) Page 10
Download files
Individual page:
Thumbnail gallery: Grid view | List view

10 REPORT OF THE KING INSTITUTE, GUINDY
effect of the scheme of reorganization upon the district returns and (3) the
possibility of changes in the potency of the lymph.
(1) The monthly returns can be divided into two distinct groups according
to the measure of success which has been attained. Between April and October
the success rate remained consistently below the average. After this period,
however, recovery took place and the results compare more favourably with those
obtained in former years. Attention has already been drawn in previous reports
to the presence of a seasonal variation which shows that the most unfavourable
months for vaccination are May, June and July. After this, conditions as a rule
gradually improve. In the present case, however, this improvement, if the slight
temporary rise in August be excluded, was delayed until November. The year
under review was a very dry one owing to the failure of the south-west monsoon
and the climatic conditions prevalent in the hot season of the year were unduly
prolonged into the cold season. It is probable that these exceptional conditions
had an adverse influence upon vaccination throughout the Presidency, and were
responsible for the extension of the " negative phase " into the autumn months.
(2) The scheme of reorganization of vaccine operations inaugurated in
compliance with G.O. No. 963 L., dated 4th July 1917,has brought about several
important changes whose influence upon the vaccination returns is felt for the
first time. Apart from the improved type of worker and the more frequent
supply of vaccine (three times instead of twice a month as previously), the most
important innovation is the introduction of the system by which results are
verified by an independent authority. Formerly, both vaccination and verification
were performed by the vaccinator, whose ability and skill were judged to a great
extent by the results he obtained. The verification has now been placed under
separate control and is now the province of the Deputy Inspector of Vaccination.
Such a change in procedure would undoubtedly bring about a greater stringency in
the examination and verification of cases, for it is only natural that the vaccinator
in the past should have judged his own work from the most optimistic point of
view. It would appear that this factor has had a profound modifying influence
upon the returns submitted this year.
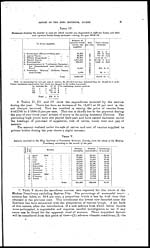
TABLE VI.
Returns recorded in the King Institute of Preventive Medicine., Guindy, for the whole of the Madras
Presidency according to districts, 1918-19.
|
Serial- |
Districts. |
Total |
Total |
Percentage |
||
|
1 |
Anantapur ... ... ... |
19,568 |
5,037 |
79.52 |
||
|
2 |
Bellary ... ... ... ... |
19,148 |
6,101 |
75.83 |
||
|
3 |
Chingleput ... ... ... |
42278 |
10,436 |
80.20 |
||
|
4 |
Chittoor ... ... ... ... |
57,054, |
9,291 |
74.42 |
||
|
5 |
Coimbatore ... ... ... |
43,049 |
21,363 |
66.83 |
||
|
6 |
Cuddapah ... ... ... |
19,518 |
4,671 |
80.68 |
||
|
7 |
Ganjām ... ... ... ... |
51,071 |
9,284 |
84.61 |
||
|
8 |
Gōdāvari ... ... ... ... |
36,621 |
22,202 |
62.25 |
||
|
9 |
Guntur ... ... ... ... |
35,977 |
10,252 |
77.82 |
||
|
10 |
Kistria ... ... ... ... |
56,337 |
15,541 |
78.37 |
||
|
11 |
Kurnool ... ... ... ... |
20,576 |
10,598 |
66.00 |
||
|
12 |
Madura ... ... ... ... |
55,894 |
10,086 |
84.71 |
||
|
13 |
Malabar ... ... ... ... |
93,682 |
17,723 |
84.00 |
||
|
14 |
Nellore ... ... ... ... |
29,102 |
14,878 |
66.17 |
||
|
15 |
Nilgiris ... ... ... ... |
4,268 |
307 |
93.28 |
||
|
16 |
North Arcot ... ... ... |
53,434 |
11,379 |
82.44 |
||
|
17 |
Rāmnād ... ... ... ... |
27,395 |
6,360 |
81.15 |
||
|
18 |
Salem ... ... ... ... |
39,541 |
11,531 |
77.42 |
||
|
19 |
South Arcot ... ... ... |
43,721 |
11,482 |
79.20 |
||
|
20 |
South Kanara ... ... ... |
41,479 |
8,012 |
83.81 |
||
|
21 |
Tanjore ... ... ... ... |
42,278 |
9,839 |
81.12 |
||
|
22 |
Tinuevelly ... ... ... |
46,629 |
18,612 |
71.47 |
||
|
23 |
Trichinopoly ... ... ... |
22,850 |
10,139 |
69.26 |
||
|
24 |
Vizagapatam ... ... ... |
76,399 |
34,306 |
69.01 |
||
|
Total ... |
947,809 |
289,430 |
76.60 |
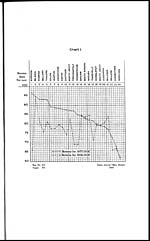
Table VI shows the districtwar success rate for the year and chart I gives
a graphic representation of the year's results compared with those obtained in
1917-18. In the chart the districts have been arranged in order according to the
Set display mode to: Large image | Zoom image | Transcription
Images and transcriptions on this page, including medium image downloads, may be used under the Creative Commons Attribution 4.0 International Licence unless otherwise stated. ![]()
| Permanent URL | https://digital.nls.uk/91179243 |
|---|
| Attribution and copyright: |
|
|---|---|
| Description | Covers 1877-1929. Details and appraises vaccination operations in the Madras Presidency. Describes manufacture and storage of lymph. Tables show particulars of vaccination. Success and mortality rates noted. Graphs included. |
|---|---|
| Shelfmark | IP/25/VA.3 |
| Additional NLS resources: | |
| Description | The Vaccination collection consists of 66 volumes dating from 1856 to 1933. Reports show how vaccination against smallpox was implemented in India. They reveal the shift from variolation, improved vaccination techniques, logistics of lymph supply, funding and staffing. They explore how the local population viewed and resisted western vaccination. |
|---|---|
| Description | The India Papers collection contains publications of the central (Imperial) Government and many Indian states. Most states came under British rule. Much of the collection dates from between the post-Mutiny re-organisation of the Indian Government and Indian Independence in 1947. Some items published in London by John Murray. |
|---|---|
| Shelfmark | India Papers |
| Additional NLS resources: | |