Medicine - Vaccination > 1877-1929 - Report on vaccination in the Madras Presidency > Report on vaccination in Madras 1904-1921 > 1916-1917 - Annual report on the vaccination in the Madras Presidency and also on the work of the vaccine section of the King Institute of Preventive Medicine, Madras for the year 1916-17
(343) Page 18
Download files
Individual page:
Thumbnail gallery: Grid view | List view

18
A—VACCINE
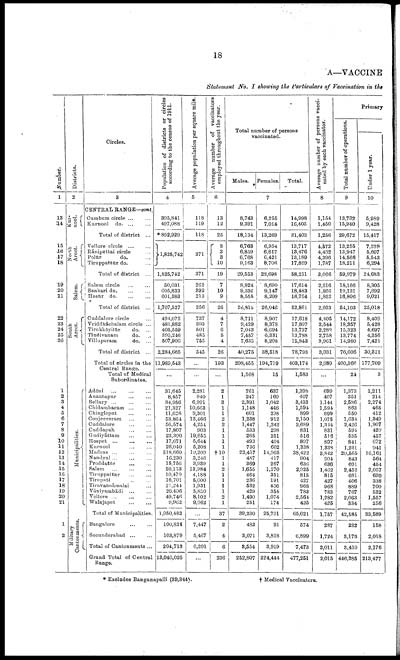
Statement No. I showing the Particulars of Vaccination in the
|
Number. |
Districts. |
Circles. |
Population of districts or circles |
Average population per square mile. |
Average number of vaccinators |
Total number of persons |
Average number of persons vacci- |
Primary |
|||
|
Total number of operations. |
|||||||||||
|
Under 1 year. |
|||||||||||
|
Males. |
Females. |
Total. |
|||||||||
|
1 |
2 |
3 |
4 |
5 |
6 |
7 |
8 |
9 |
10 |
||
|
CENTRAL RANGE—cont. |
|||||||||||
|
13 |
Kur- |
Cumbum circle ... ... |
395,841 |
118 |
13 |
8,743 |
6,255 |
14,998 |
1,1541 |
13,732 |
5,989 |
|
14 |
Kurnool do. ... ... |
497,088 |
119 |
12 |
9,391 |
7,014 |
16,405 |
1,450 |
15,940 |
9,428 |
|
|
Total of district ... |
* 892,929 |
118 |
25 |
18,134 |
13,269 |
31,403 |
1,256 |
29,672 |
15,417 |
||
|
15 |
North |
Vellore circle ... ... |
1,825,742 |
371 |
3 |
6,763 |
6,954 |
13,717 |
4,572 |
13,255 |
7,239 |
|
16 |
Rānipēttai circle ... |
3 |
6,859 |
6,617 |
13,476 |
4,492 |
13,947 |
5,607 |
|||
|
17 |
Polūr do. ... |
3 |
6,768 |
6,421 |
13,189 |
4,396 |
14,566 |
5,543 |
|||
|
18 |
Tiruppattūr do. ... |
10 |
9,163 |
8,706 |
17,869 |
1,787 |
18,211 |
6,294 |
|||
|
Total of district ... |
1,825,742 |
371 |
19 |
29,553 |
28,698 |
58,251 |
3,066 |
59,979 |
24,683 |
||
|
19 |
Salem. |
Salem circle ... ... |
50,031 |
262 |
7 |
8,924 |
8,690 |
17,614 |
2,516 |
18,166 |
8,305 |
|
20 |
Sankari do. ... ... |
605,833 |
392 |
10 |
9,336 |
9,147 |
18,483 |
1,866 |
19,131 |
7,692 |
|
|
21 |
Hosūr do. ... ... |
601,383 |
213 |
9 |
8,555 |
8,209 |
16,764 |
1,852 |
16,806 |
9,021 |
|
|
Total of district ... |
1,707,527 |
256 |
26 |
26,815 |
26,046 |
52,861 |
2,033 |
54,103 |
25,018 |
||
|
22 |
South |
Cuddalore circle ... |
494,072 |
737 |
4 |
8,711 |
8,907 |
17,618 |
4,405 |
14,172 |
8,409 |
|
23 |
Vriddhāchalam circle ... |
481,882 |
393 |
7 |
9,429 |
8,378 |
17,807 |
2,544 |
18,357 |
5,428 |
|
|
24 |
Tirukkōyilur do. ... |
405,559 |
501 |
6 |
7,043 |
6,694 |
13,737 |
2,289 |
15,323 |
4,697 |
|
|
25 |
Tindivanam do. ... |
395,246 |
485 |
5 |
7,457 |
6,331 |
13,788 |
2,758 |
13,774 |
4,356 |
|
|
26 |
Villupuram do. ... |
507,906 |
755 |
4 |
7,635 |
8,208 |
15,843 |
3,961 |
14,980 |
7,421 |
|
|
Total of district ... |
2,284,665 |
545 |
26 |
40,275 |
38,518 |
78,793 |
3,031 |
76,606 |
30,311 |
||
|
Total of circles in the |
11,989,543 |
... |
193 |
208,455 |
194,719 |
403,174 |
2,089 |
400,366 |
177,709 |
||
|
Total of Medical |
... |
... |
... |
1,568 |
15 |
1,583 |
... |
24 |
3 |
||
|
1 |
Municipalities. |
Adōni ... ... ... |
31,645 |
2,281 |
2 |
761 |
637 |
1,398 |
699 |
1,373 |
1,211 |
|
2 |
Anantapur ... ... |
8,457 |
940 |
1 |
247 |
160 |
407 |
407 |
351 |
214 |
|
|
3 |
Bellary ... ... ... |
34,956 |
6,991 |
3 |
2,391 |
1,042 |
3,433 |
1,144 |
2,586 |
2,274 |
|
|
4 |
Chidambaram ... ... |
21,327 |
10,663 |
1 |
1,148 |
446 |
1,594 |
1,594 |
863 |
465 |
|
|
5 |
Chingleput ... ... |
11,626 |
9,301 |
1 |
601 |
298 |
899 |
899 |
550 |
412 |
|
|
6 |
Conjeeveram ... ... |
53,864 |
13,466 |
2 |
1,238 |
912 |
2,150 |
1,075 |
1,634 |
1,349 |
|
|
7 |
Cuddalore ... ... |
56,574 |
4,254 |
2 |
1,447 |
1,242 |
2,689 |
1,314 |
2,426 |
1,907 |
|
|
8 |
Cuddapah ... ... |
17,807 |
903 |
1 |
533 |
298 |
831 |
831 |
591 |
429 |
|
|
9 |
Gudiyāttam ... ... |
23,390 |
19,655 |
1 |
265 |
251 |
516 |
516 |
535 |
457 |
|
|
10 |
Hospet ... ... ... |
17,671 |
5,644 |
1 |
493 |
404 |
897 |
897 |
841 |
672 |
|
|
11 |
Kurnool ... ... |
26,040 |
5,208 |
1 |
736 |
602 |
1,338 |
1,338 |
1,231 |
941 |
|
|
12 |
Madras ... ... ... |
518,660 |
19,209 |
†10 |
23,457 |
14,965 |
38,422 |
3,842 |
20,565 |
16,161 |
|
|
13 |
Nandyal ... ... ... |
16,230 |
3,246 |
1 |
487 |
417 |
904 |
904 |
843 |
564 |
|
|
14 |
Proddatūr ... ... |
15,756 |
3,939 |
1 |
369 |
267 |
636 |
636 |
601 |
454 |
|
|
15 |
Salem ... ... ... |
59,153 |
13,984 |
2 |
1,655 |
1,270 |
2,925 |
1,462 |
2,452 |
2,057 |
|
|
16 |
Tiruppattur ... ... |
10,470 |
4,188 |
1 |
464 |
351 |
815 |
815 |
681 |
639 |
|
|
17 |
Tirupati ... ... |
16,701 |
5,000 |
1 |
236 |
191 |
427 |
427 |
406 |
338 |
|
|
18 |
Tiruvannāmalai ... |
21,244 |
1,931 |
1 |
532 |
436 |
968 |
968 |
889 |
700 |
|
|
19 |
Vāniyambādi ... ... |
20,406 |
5,830 |
1 |
429 |
354 |
783 |
783 |
767 |
532 |
|
|
20 |
Vellore ... ... ... |
49,746 |
8,102 |
2 |
1,490 |
1,074 |
2,564 |
1,282 |
2,063 |
1,557 |
|
|
21 |
Walajapet ... ... |
9,962 |
9,962 |
1 |
251 |
174 |
425 |
425 |
334 |
256 |
|
|
Total of Municipalities. |
1,050,482 |
... |
37 |
39,230 |
25,791 |
65,021 |
1,757 |
42,585 |
33,589 |
||
|
1 |
Military |
Bangalore ... ... |
100,834 |
7,447 |
2 |
483 |
91 |
574 |
287 |
232 |
158 |
|
2 |
Secunderabad ... ... |
103,879 |
5,467 |
4 |
3,071 |
3,828 |
6,899 |
1,724 |
3,178 |
2,018 |
|
|
Total of Cantonments ... |
204,713 |
6,291 |
6 |
3,554 |
3,919 |
7,473 |
2,011 |
3,410 |
2,176 |
||
|
Grand Total of Central |
13,040,025 |
... |
236 |
252,807 |
224,444 |
477,251 |
2,015 |
446,385 |
213,477 |
||
* Excludes Banganapalli (39,344). † Medical Vaccinators.
Set display mode to: Large image | Zoom image | Transcription
Images and transcriptions on this page, including medium image downloads, may be used under the Creative Commons Attribution 4.0 International Licence unless otherwise stated. ![]()
| Permanent URL | https://digital.nls.uk/91178913 |
|---|
| Attribution and copyright: |
|
|---|---|


