Medicine - Vaccination > 1877-1929 - Report on vaccination in the Madras Presidency > Report on vaccination in Madras 1904-1921 > 1914-1915 - Annual report on the vaccination in the Madras Presidency and also on the work of the vaccine section of the King Institute of Preventive Medicine, Madras for the year 1914-15
(227) Page 26
Download files
Individual page:
Thumbnail gallery: Grid view | List view

26
A—VACCINE
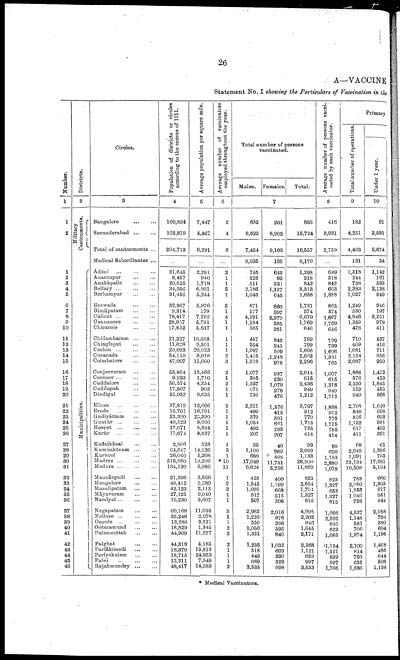
Statement No. I showing the Particulars of Vaccination in the
|
Number. |
Districts. |
Circles. |
Population of districts or circles |
Average population per square mile. |
Average number of vaccinators |
Total number of persons |
Average number of persons vacci- |
Primary |
|||
|
Total number of operations. |
|||||||||||
|
Under 1 year. |
|||||||||||
|
Males. |
Females. |
Total. |
|||||||||
|
1 |
2 |
3 |
4 |
5 |
6 |
7 |
8 |
9 |
10 |
||
|
1 |
Military |
Bangalore ... ... |
100,834 |
7,447 |
2 |
632 |
201 |
833 |
416 |
182 |
91 |
|
2 |
Secunderabad ... ... |
103,879 |
5,467 |
4 |
6,822 |
8,902 |
15,724 |
3,931 |
4,251 |
2,583 |
|
|
Total of cantonments ... |
204,713 |
6,291 |
6 |
7,454 |
9,103 |
16,557 |
2,759 |
4,433 |
2,674 |
||
|
Medical Subordinates ... |
... |
... |
... |
8,035 |
135 |
8,170 |
... |
131 |
54 |
||
|
1 |
Municipalities. |
Ādōni ... ... ... |
31,645 |
2,281 |
2 |
755 |
643 |
1,398 |
699 |
1,318 |
1,142 |
|
2 |
Anantapur ... ... |
8,457 |
940 |
1 |
223 |
95 |
318 |
318 |
244 |
161 |
|
|
3 |
Anakāpalle ... ... |
20,625 |
1,719 |
1 |
511 |
331 |
842 |
842 |
738 |
583 |
|
|
4 |
Bellary ... ... ... |
34,956 |
6,991 |
5 |
2,186 |
1,127 |
3,313 |
663 |
2,383 |
2,138 |
|
|
5 |
Berhampur ... ... |
31,456 |
5,244 |
1 |
1,043 |
645 |
1,688 |
1,688 |
1,027 |
849 |
|
|
6 |
Bezwada ... ... |
32,867 |
5,976 |
2 |
871 |
860 |
1,731 |
865 |
1,249 |
946 |
|
|
7 |
Bimlipatam ... ... |
9,314 |
179 |
1 |
177 |
397 |
574 |
574 |
330 |
197 |
|
|
8 |
Calicut ... ... ... |
78,417 |
7,292 |
4 |
4,291 |
2,379 |
6,670 |
1,667 |
4,846 |
3,251 |
|
|
9 |
Cannanore ... ... |
28,957 |
5,791 |
1 |
1,184 |
585 |
1,769 |
1,769 |
1,359 |
979 |
|
|
10 |
Chicacole ... ... |
17,852 |
5,617 |
1 |
365 |
281 |
646 |
646 |
476 |
411 |
|
|
11 |
Chidambaram ... ... |
21,327 |
10,663 |
1 |
457 |
342 |
799 |
799 |
710 |
537 |
|
|
12 |
Chingleput ... ... |
11,626 |
9,301 |
1 |
554 |
245 |
799 |
799 |
469 |
416 |
|
|
13 |
Cochin ... ... ... |
20,023 |
20,023 |
1 |
1,097 |
509 |
1,606 |
1,606 |
1,081 |
711 |
|
|
14 |
Cocanada ... ... |
54,110 |
9,018 |
2 |
1,415 |
,1,248 |
2,663 |
1,331 |
2,134 |
956 |
|
|
15 |
Coimbatore ... ... |
47,007 |
11,060 |
3 |
1,318 |
978 |
2,296 |
765 |
2,087 |
950 |
|
|
16 |
Conjeeveram ... ... |
53,864 |
13,466 |
2 |
1,077 |
937 |
2,014 |
1,007 |
1,886 |
1,412 |
|
|
17 |
Coonoor ... ... ... |
9,933 |
1,710 |
1 |
385 |
230 |
615 |
615 |
576 |
419 |
|
|
18 |
Cuddalore ... ... |
56,574 |
4,254 |
2 |
1,357 |
1,079 |
2,436 |
1,218 |
2,230 |
1,845 |
|
|
19 |
Cuddapah ... ... |
17,807 |
903 |
1 |
671 |
278 |
949 |
949 |
559 |
455 |
|
|
20 |
Dindigul ... ... |
25,052 |
9,635 |
1 |
736 |
476 |
1,212 |
1,212 |
940 |
866 |
|
|
21 |
Ellore ... ... ... |
37,819 |
12,606 |
2 |
2,221 |
1,576 |
3,797 |
1,898 |
2,708 |
1,640 |
|
|
22 |
Erode ... ... ... |
16,701 |
16,701 |
1 |
499 |
413 |
912 |
912 |
840 |
608 |
|
|
23 |
Gudiyāttam ... ... |
23,390 |
23,390 |
1 |
379 |
391 |
770 |
770 |
816 |
693 |
|
|
24 |
Guntūr ... ... ... |
40,529 |
9,006 |
1 |
1,054 |
661 |
1,715 |
1,715 |
1,132 |
981 |
|
|
25 |
Hospet ... ... ... |
17,671 |
5,644 |
1 |
492 |
293 |
785 |
785 |
617 |
495 |
|
|
26 |
Karūr ... ... ... |
17,674 |
8,837 |
1 |
207 |
207 |
414 |
414 |
411 |
391 |
|
|
27 |
Kodaikānal ... ... |
2,906 |
528 |
1 |
59 |
40 |
99 |
99 |
68 |
61 |
|
|
28 |
Kumbakōnam ... ... |
64,647 |
14,626 |
3 |
1,100 |
969 |
2,069 |
690 |
2,049 |
1,396 |
|
|
29 |
Kurnool ... ... |
26,040 |
5,208 |
1 |
688 |
495 |
1,183 |
1,183 |
1,091 |
765 |
|
|
30 |
Madras ... ... ... |
518,660 |
19,209 |
*10 |
17,049 |
11,751 |
28,800 |
2,880 |
22,134 |
17,681 |
|
|
31 |
Madura ... ... ... |
134,130 |
5,086 |
11 |
6,624 |
5,236 |
11,860 |
1,078 |
10,509 |
5,164 |
|
|
32 |
Mannārgudi ... ... |
21,398 |
3,566 |
1 |
423 |
400 |
823 |
823 |
788 |
660 |
|
|
33 |
Mangalore ... ... |
48,412 |
9,680 |
2 |
1,545 |
1,109 |
2,654 |
1,327 |
2,080 |
1,303 |
|
|
34 |
Masulipatam ... ... |
42,123 |
2,113 |
2 |
1,036 |
668 |
1,704 |
852 |
1,353 |
917 |
|
|
35 |
Māyavaram ... ... |
27,121 |
9,040 |
1 |
812 |
515 |
1,327 |
1,327 |
1,046 |
851 |
|
|
36 |
Nandyal ... ... ... |
16,230 |
3,607 |
1 |
507 |
308 |
815 |
815 |
726 |
444 |
|
|
37 |
Negapatam ... ... |
60,168 |
11,638 |
3 |
2,982 |
2,016 |
4,998 |
1,666 |
4,337 |
2,188 |
|
|
38 |
Nellore ... ... ... |
33,246 |
2,078 |
1 |
1,226 |
976 |
2,202 |
2,202 |
1,148 |
704 |
|
|
39 |
Ongole ... ... ... |
13,286 |
3,321 |
1 |
550 |
396 |
946 |
946 |
581 |
380 |
|
|
40 |
Ootacamund ... ... |
18,829 |
1,345 |
2 |
1,050 |
595 |
1,645 |
823 |
706 |
604 |
|
|
41 |
Palamcottah ... ... |
44,909 |
11,227 |
2 |
1,331 |
840 |
2,171 |
1,085 |
1,974 |
1,195 |
|
|
42 |
Palghat ... ... |
44,319 |
4,185 |
2 |
1,235 |
1,033 |
2,268 |
1,134 |
2,100 |
1,468 |
|
|
43 |
Parlākimedi ... ... |
18,370 |
13,812 |
1 |
518 |
603 |
1,121 |
1,121 |
814 |
485 |
|
|
44 |
Periyakulam ... ... |
18,715 |
24,953 |
1 |
449 |
390 |
839 |
839 |
750 |
644 |
|
|
45 |
Palni ... ... ... |
13,211 |
7,549 |
1 |
669 |
328 |
997 |
997 |
635 |
508 |
|
|
46 |
Rajahmundry... ... |
48,417 |
14,583 |
2 |
2,535 |
998 |
3,533 |
1,766 |
1,836 |
1,124 |
|
* Medical Vaccinators.
Set display mode to: Large image | Zoom image | Transcription
Images and transcriptions on this page, including medium image downloads, may be used under the Creative Commons Attribution 4.0 International Licence unless otherwise stated. ![]()
| Permanent URL | https://digital.nls.uk/91178565 |
|---|
| Attribution and copyright: |
|
|---|---|


