Medicine - Vaccination > 1877-1929 - Report on vaccination in the Madras Presidency > Report on vaccination in Madras 1895-1903 > 1894-1895 - Report on vaccination in the Madras Presidency for the year 1894-95
(45) Page 28
Download files
Individual page:
Thumbnail gallery: Grid view | List view

28 APPENDIX.
A—VACCINE
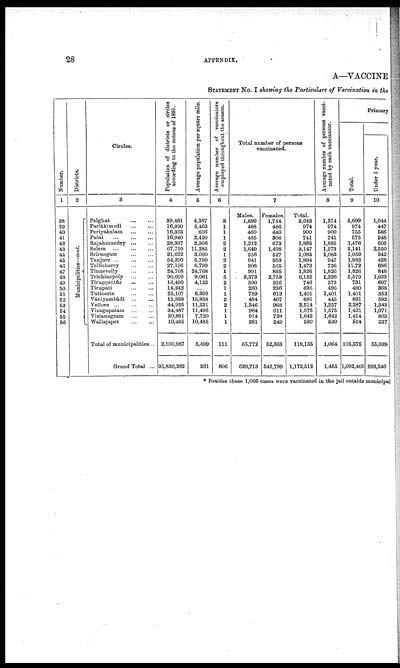
STATEMENT No. I showing the Particulars of Vaccination in the
|
Number. |
Districts. |
Circles. |
Population of districts or circles |
Average population per square mile. |
Average number of vaccinators |
Total number of persons |
Average number of persons vacci- |
Primary |
|||
|
Total. |
|||||||||||
|
Under 1 year. |
|||||||||||
|
1 |
2 |
3 |
4 |
5 |
6 |
7 |
8 |
9 |
10 |
||
|
Males. |
Females. |
Total. |
|||||||||
|
38 |
Municipalities—cont. |
Palghat ... ... |
39,481 |
4,387 |
3 |
1,899 |
1,744 |
3,643 |
1,214 |
3,609 |
1,044 |
|
39 |
Parlákimedi ... ... |
16,390 |
5,463 |
1 |
488 |
486 |
974 |
974 |
974 |
447 |
|
|
40 |
Periyakulam ... ... |
16,363 |
606 |
1 |
460 |
440 |
900 |
900 |
755 |
586 |
|
|
41 |
Palni ... ... ... |
16,940 |
2,420 |
1 |
435 |
306 |
741 |
741 |
575 |
248 |
|
|
42 |
Rajahmundry ... ... |
28,397 |
2,366 |
2 |
1,212 |
673 |
1,885 |
1,885 |
1,476 |
603 |
|
|
43 |
Salem ... ... ... |
67,710 |
11,285 |
2 |
1,649 |
1,498 |
3,147 |
1,573 |
3,141 |
2,550 |
|
|
44 |
Srírangam ... ... |
21,632 |
3,090 |
1 |
556 |
527 |
1,083 |
1,083 |
1,059 |
342 |
|
|
45 |
Tanjore ... ... ... |
54,390 |
6,799 |
2 |
941 |
953 |
1,894 |
947 |
1,882 |
428 |
|
|
46 |
Tellicherry ... ... |
27,196 |
6,799 |
2 |
908 |
565 |
1,473 |
736 |
11,72 |
686 |
|
|
47 |
Tinnevelly ... ... |
24,768 |
24,768 |
1 |
991 |
835 |
1,826 |
1,826 |
1,826 |
848 |
|
|
48 |
Trichinopoly ... ... |
90,609 |
9,061 |
5 |
3,373 |
2,759 |
6,132 |
1,226 |
5,579 |
1,632 |
|
|
49 |
Tiruppattúr ... ... |
16,499 |
4,125 |
2 |
390 |
356 |
746 |
373 |
731 |
607 |
|
|
50 |
Tirupati ... ... |
14,242 |
... |
1 |
260 |
236 |
496 |
496 |
480 |
368 |
|
|
51 |
Tuticorin ... ... |
25,107 |
8,369 |
1 |
789 |
612 |
1,401 |
1,401 |
1,401 |
352 |
|
|
52 |
Vániyambádi ... ... |
15,838 |
15,838 |
2 |
484 |
407 |
891 |
445 |
891 |
582 |
|
|
53 |
Vellore ... ... ... |
44,925 |
11,231 |
2 |
1,546 |
968 |
2,514 |
1,257 |
2,287 |
1,343 |
|
|
54 |
Vizagapatam ... ... |
34,487 |
11,496 |
1 |
964 |
611 |
1,575 |
1,575 |
1,421 |
1,071 |
|
|
55 |
Vizianagram ... ... |
30,881 |
7,720 |
1 |
914 |
728 |
1,642 |
1,642 |
1,414 |
863 |
|
|
56 |
Wallajapet ... ... |
10,485 |
10,485 |
1 |
281 |
249 |
530 |
530 |
514 |
337 |
|
|
Total of municipalities... |
2,100,967 |
5,499 |
111 |
65,772 |
52,363 |
118,135 |
1,064 |
105,575 |
55,039 |
||
|
Grand Total ... |
35,830,282 |
261 |
806 |
629,713 |
542,799 |
1,172,512 |
1,455 |
1,092,405 |
293,540 |
||
* Besides these 1,066 cases were vaccinated in the jail outside municipal
Set display mode to: Large image | Zoom image | Transcription
Images and transcriptions on this page, including medium image downloads, may be used under the Creative Commons Attribution 4.0 International Licence unless otherwise stated. ![]()
| Permanent URL | https://digital.nls.uk/91176246 |
|---|
| Attribution and copyright: |
|
|---|


