Medicine - Vaccination > 1877-1929 - Report on vaccination in the Madras Presidency > Report on vaccination in Madras 1895-1903 > 1894-1895 - Report on vaccination in the Madras Presidency for the year 1894-95
(22) Page 10
Download files
Individual page:
Thumbnail gallery: Grid view | List view

10 VACCINATION REPORT.
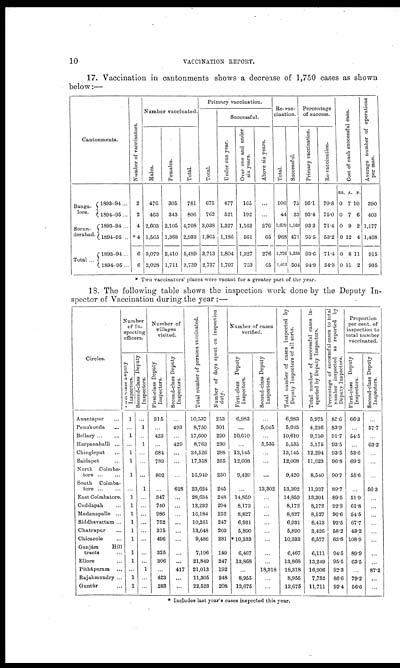
17. Vaccination in cantonments shows a decrease of 1,750 cases as shown
below:—
|
Cantonments. |
Number of vaccinators. |
Number vaccinated. |
Primary vaccination. |
Re-vac- |
Percentage |
Cost of each successful case. |
Average number of operations |
||||||||||
|
Total. |
Successful. |
||||||||||||||||
|
Males. |
Females. |
Total. |
Under one year. |
Over one and under |
Above six years. |
Total. |
Successful. |
Primary vaccination. |
Re-vaccination. |
||||||||
|
RS. |
A. |
P. |
|||||||||||||||
|
Banga- |
1893-94... |
2 |
476 |
305 |
781 |
675 |
477 |
165 |
... |
106 |
75 |
95.1 |
70.8 |
0 |
7 |
10 |
390 |
|
1894-95... |
2 |
463 |
343 |
806 |
762 |
521 |
192 |
... |
44 |
33 |
93.4 |
75.0 |
0 |
7 |
6 |
403 |
|
|
Secun- |
1893-94... |
4 |
2,603 |
2,105 |
4,708 |
3,038 |
1,327 |
1,162 |
276 |
1,079 |
1,100 |
93.3 |
71.4 |
0 |
9 |
2 |
1,177 |
|
1894-95... |
*4 |
1,565 |
1,368 |
2,933 |
1,965 |
1,186 |
561 |
65 |
968 |
471 |
95.5 |
53.2 |
0 |
12 |
4 |
1,468 |
|
|
Total... |
1893-94... |
6 |
3,079 |
2,410 |
5,489 |
3,713 |
1,804 |
1,327 |
276 |
1,770 |
1,235 |
93.6 |
71.4 |
0 |
8 |
11 |
915 |
|
1894-95... |
6 |
2,028 |
1,711 |
3,739 |
2,727 |
1,707 |
753 |
65 |
1,012 |
504 |
94.9 |
54.3 |
0 |
11 |
2 |
935 |
|
* Two vaccinators' places were vacant for a greater part of the year.
18. The following table shows the inspection work done by the Deputy In-
spector of Vaccination during the year :—
|
Circles. |
Number |
Number of |
Total number of persons vaccinated. |
Number of days spent on inspection |
Number of cases |
Total number of cases inspected by |
Total number of successful cases in- |
Percentage of successful cases to total |
Proportion |
||||
|
Inspectors. |
Second-class Deputy |
First-class Deputy |
Second-class Deputy |
First-class Deputy |
Second -class Deputy |
First-class Deputy |
Second-class Deputy |
||||||
|
Anantapur ... |
1 |
... |
315 |
... |
10,537 |
253 |
6,983 |
... |
6,983 |
5,975 |
85.6 |
66.3 |
... |
|
Penukonda ... |
... |
1 |
... |
493 |
8,750 |
301 |
... |
5,045 |
5,045 |
4,236 |
83.9 |
... |
57.7 |
|
Bellary ... ... |
1 |
... |
423 |
... |
17,600 |
290 |
10,610 |
... |
10,610 |
9,730 |
91.7 |
54.5 |
... |
|
Harpanahalli ... |
... |
1 |
... |
429 |
8,763 |
230 |
... |
5,535 |
5,535 |
5,175 |
93.5 |
... |
63.2 |
|
Chingleput ... |
1 |
... |
684 |
... |
24,526 |
288 |
13,145 |
... |
13,145 |
12,294 |
93.5 |
53.6 |
... |
|
Saidapet ... |
1 |
... |
789 |
... |
17,358 |
255 |
12,008 |
... |
12,008 |
11,623 |
96.8 |
69.2 |
... |
|
North Coimba- |
1 |
... |
802 |
... |
16,949 |
230 |
9,420 |
... |
9,420 |
8,540 |
90.7 |
55.6 |
... |
|
South Coimba- |
... |
1 |
... |
628 |
23,624 |
245 |
... |
13,302 |
13,302 |
11,937 |
89.7 |
... |
56.3 |
|
East Coimbatore. |
... |
... |
347 |
... |
28,634 |
248 |
14,859 |
... |
14,859 |
13,301 |
89.5 |
51.9 |
... |
|
Cuddapah ... |
... |
... |
740 |
... |
13,232 |
294 |
8,172 |
... |
8,172 |
8,172 |
92.2 |
61.8 |
... |
|
Madanapalle ... |
... |
... |
986 |
... |
16,184 |
252 |
8,827 |
... |
8,827 |
8,527 |
96.6 |
54.5 |
... |
|
Siddhavattam ... |
... |
... |
752 |
... |
10,251 |
247 |
6,931 |
... |
6,931 |
6,413 |
92.5 |
67.7 |
... |
|
Chatrapur ... |
... |
... |
315 |
... |
13,648 |
203 |
5,890 |
... |
5,890 |
3,426 |
58.2 |
43.2 |
... |
|
Chicacole ... |
... |
... |
496 |
... |
9,486 |
281 |
* 10,333 |
... |
10,333 |
6,577 |
63.6 |
108.9 |
... |
|
Ganjám Hill |
... |
... |
325 |
... |
7,196 |
149 |
6,467 |
... |
6,467 |
6,111 |
94.5 |
89.9 |
... |
|
Ellore ... |
... |
... |
306 |
... |
21,849 |
247 |
13,868 |
... |
13,868 |
13,249 |
95.5 |
63.5 |
... |
|
Pithápuram ... |
... |
1 |
... |
417 |
21,013 |
192 |
... |
18,318 |
18,318 |
16,906 |
92.3 |
... |
87.2 |
|
Rajahmundry ... |
... |
... |
423 |
... |
11,305 |
248 |
8,955 |
... |
8,955 |
7,752 |
86.6 |
79.2 |
... |
|
Guntúr ... |
... |
... |
283 |
... |
22,523 |
208 |
12,675 |
... |
12,675 |
11,711 |
92.4 |
56.6 |
... |
* Includes last year's cases inspected this year.
Set display mode to: Large image | Zoom image | Transcription
Images and transcriptions on this page, including medium image downloads, may be used under the Creative Commons Attribution 4.0 International Licence unless otherwise stated. ![]()
| Permanent URL | https://digital.nls.uk/91176177 |
|---|
| Attribution and copyright: |
|
|---|


