

Medicine - Vaccination > 1877-1929 - Report on vaccination in the Madras Presidency > Report on vaccination in Madras 1877-1894 > 1892-1893 - Report on vaccination in the Madras Presidency for the year 1892-93
(366) Page 30
Download files
Individual page:
Thumbnail gallery: Grid view | List view
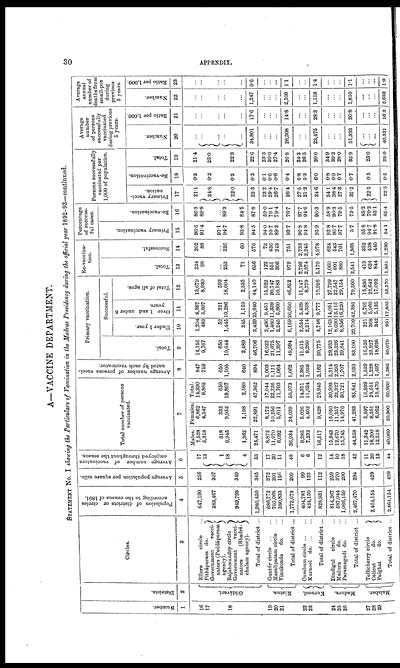
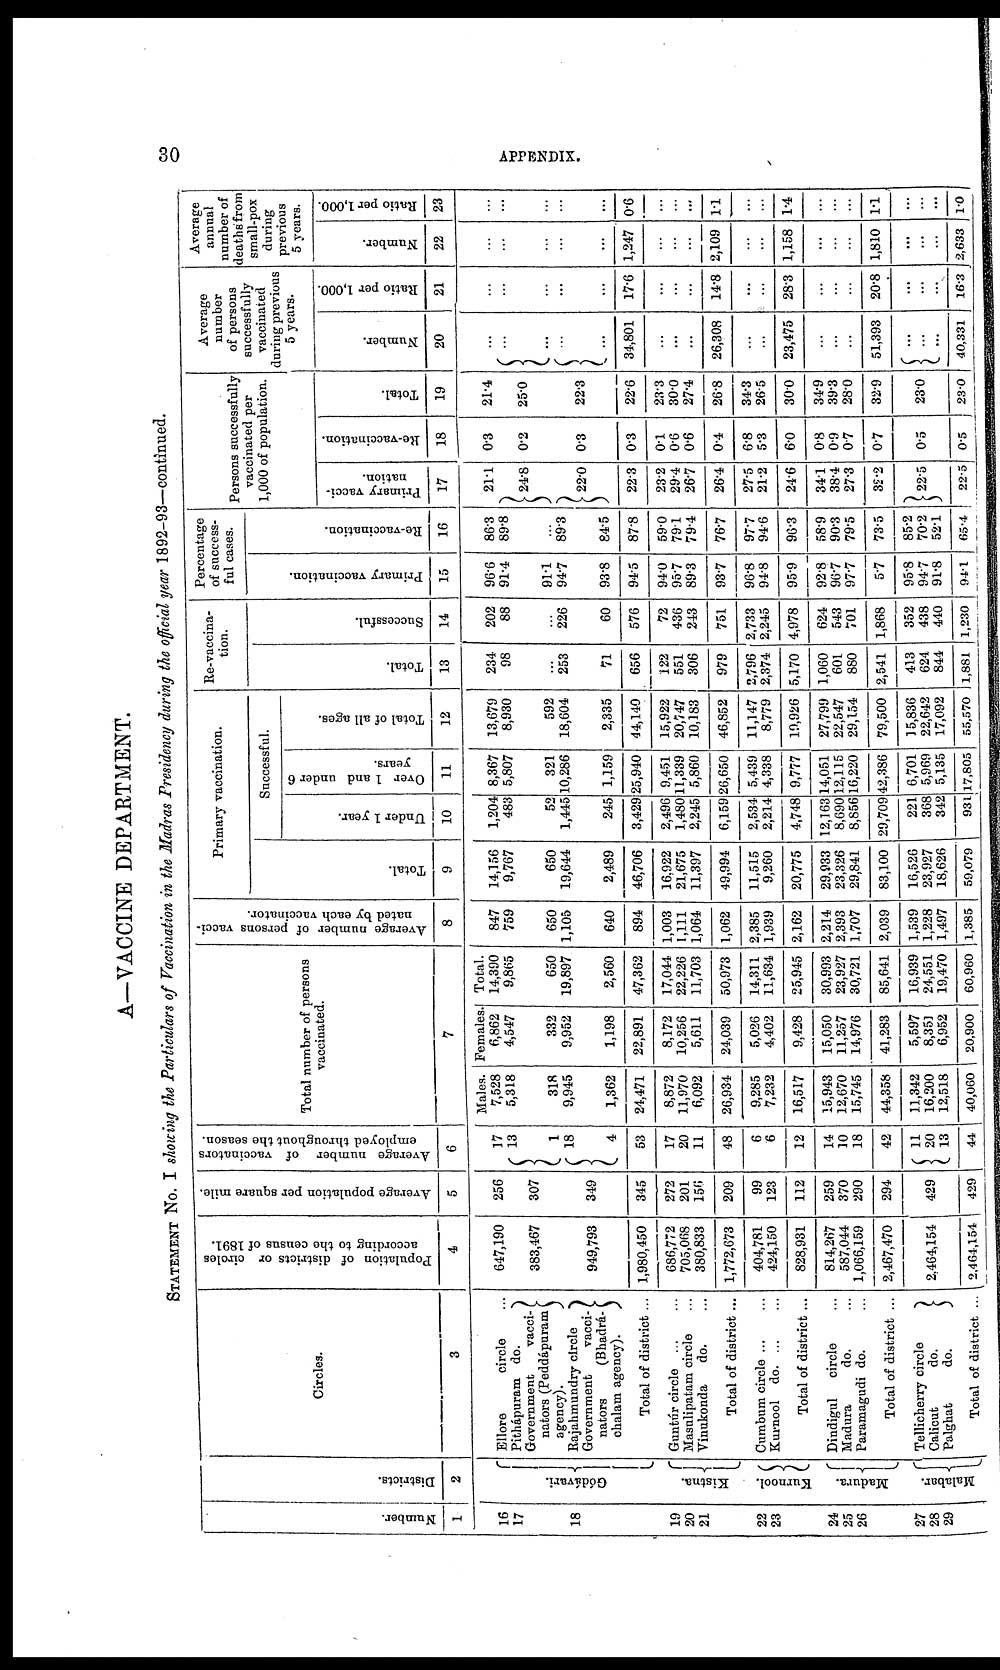
30 APPENDIX.
A—VACCINE DEPARTMENT.
STATEMENT No. I showing the Particulars of Vaccination in the Madras Presidency during the official year 1892-93—continued.
|
Number. |
Districts. |
Circles. |
Population of districts or circles |
Average population per square mile. |
Average number of vaccinators |
Total number of persons |
Average number of persons vacci- |
Primary vaccination. |
Re-vaccina- |
Percentage |
Persons successfully |
Average |
Average |
|||||||||||
|
Total. |
Successful. |
Total. |
Successful. |
Primary vaccination. |
Re-vaccination. |
|||||||||||||||||||
|
Under 1 year. |
Over 1 and under 6 |
Total of all ages. |
||||||||||||||||||||||
|
Primary vacci- |
Re-vaccination. |
Total. |
Number. |
Ratio per 1,000. |
Number. |
Ratio per 1,000. |
||||||||||||||||||
|
1 |
2 |
3 |
4 |
5 |
6 |
7 |
8 |
9 |
10 |
11 |
12 |
13 |
14 |
15 |
16 |
17 |
18 |
19 |
20 |
21 |
22 |
23 |
||
|
Males. |
Females. |
Total. |
||||||||||||||||||||||
|
16 |
Gódávari. |
Ellore circle ... |
647,190 |
256 |
17 |
7,528 |
6,862 |
14,390 |
847 |
14,156 |
1,204 |
8,367 |
13,679 |
234 |
202 |
96.6 |
86.3 |
21.1 |
0.3 |
21.4 |
... |
... |
... |
... |
|
17 |
Pithápuram do. |
383,467 |
307 |
13 |
5,318 |
4,547 |
9,865 |
759 |
9,767 |
483 |
5,807 |
8,930 |
98 |
88 |
91.4 |
89.8 |
24.8 |
0.2 |
25.0 |
... |
... |
... |
... |
|
|
1 |
318 |
332 |
650 |
650 |
650 |
52 |
321 |
592 |
... |
... |
91.1 |
... |
... |
... |
... |
... |
||||||||
|
18 |
Rajahmundry circle |
949,793 |
349 |
18 |
9,945 |
9,952 |
19,897 |
1,105 |
19,644 |
1,445 |
10,286 |
18,604 |
253 |
226 |
94.7 |
89.3 |
22.0 |
0.3 |
22.3 |
... |
... |
... |
... |
|
|
4 |
1,362 |
1,198 |
2,560 |
640 |
2,489 |
245 |
1,159 |
2,335 |
71 |
60 |
93.8 |
84.5 |
... |
... |
... |
... |
||||||||
|
Total of district ... |
1,980,450 |
345 |
53 |
24,471 |
22,891 |
47,362 |
894 |
46,706 |
3,429 |
25,940 |
44,140 |
656 |
576 |
94.5 |
87.8 |
22.3 |
0.3 |
22.6 |
34,801 |
17.6 |
1,247 |
0.6 |
||
|
19 |
Kistma. |
Guntúr circle ... ... |
686,772 |
272 |
17 |
8,872 |
8,172 |
17,044 |
1,003 |
16,922 |
2,496 |
9,451 |
15,922 |
122 |
72 |
94.0 |
59.0 |
23.2 |
0.1 |
23.3 |
... |
... |
... |
... |
|
20 |
Masulipatam circle ... |
705,068 |
201 |
20 |
11,970 |
10,256 |
22,226 |
1,111 |
21,675 |
1,480 |
11,339 |
20,747 |
551 |
436 |
95.7 |
79.1 |
29.4 |
0.6 |
30.0 |
... |
... |
... |
... |
|
|
21 |
Yinukonda do. ... |
380,833 |
156 |
11 |
6,092 |
5,611 |
11,703 |
1,064 |
11,397 |
2,245 |
5,860 |
10,183 |
306 |
243 |
89.3 |
79.4 |
26.7 |
0.6 |
27.4 |
... |
... |
... |
... |
|
|
Total of district ... |
1,772,673 |
209 |
48 |
26,934 |
24,039 |
50,973 |
1,062 |
49,994 |
6,159 |
26,650 |
46,852 |
979 |
751 |
93.7 |
76.7 |
26.4 |
0.4 |
26.8 |
26,308 |
14.8 |
2,109 |
1.1 |
||
|
22 |
Kurnool. |
Cumbum circle ... ... |
404,781 |
99 |
6 |
9,285 |
5,026 |
14,311 |
2,385 |
11,515 |
2,534 |
5,439 |
11,147 |
2,796 |
2,733 |
96.8 |
97.7 |
27.5 |
6.8 |
34.3 |
... |
... |
... |
... |
|
23 |
Kurnool do. ... ... |
424,150 |
123 |
6 |
7,232 |
4,402 |
11,634 |
1,939 |
9,260 |
2,214 |
4,338 |
8,779 |
2,374 |
2,245 |
94.8 |
94.6 |
21.2 |
5.3 |
26.5 |
... |
... |
... |
... |
|
|
Total of district ... |
828,931 |
112 |
12 |
16,517 |
9,428 |
25,945 |
2,162 |
20,775 |
4,748 |
9,777 |
19,926 |
5,170 |
4,978 |
95.9 |
96.3 |
24.6 |
6.0 |
30.0 |
23,475 |
28.3 |
1,158 |
1.4 |
||
|
24 |
Madura. |
Dindigul circle ... |
814,267 |
259 |
14 |
15,943 |
15,050 |
30,993 |
2,214 |
29,933 |
12,163 |
14,051 |
27,799 |
1,060 |
624 |
92.8 |
58.9 |
34.1 |
0.8 |
34.9 |
... |
... |
... |
... |
|
25 |
Madura do. ... |
587,044 |
370 |
10 |
12,670 |
11,257 |
23,927 |
2,393 |
23,326 |
8,690 |
12,115 |
22,547 |
601 |
543 |
96.7 |
90.3 |
38.4 |
0.9 |
39.3 |
... |
... |
... |
... |
|
|
26 |
Paramagudi do. ... |
1,066,159 |
290 |
18 |
15,745 |
14,976 |
30,721 |
1,707 |
29,841 |
8,856 |
16,220 |
29,154 |
880 |
701 |
97.7 |
79.5 |
27.3 |
0.7 |
28.0 |
... |
... |
... |
... |
|
|
Total of district ... |
2,467,470 |
294 |
42 |
44,358 |
41,283 |
85,641 |
2,039 |
83,100 |
29,709 |
42,386 |
79,500 |
2,541 |
1,868 |
5.7 |
73.5 |
32.2 |
0.7 |
32.9 |
51,393 |
20.8 |
1,810 |
1.1 |
||
|
27 |
Malabar. |
Tellicherry circle |
2,464,154 |
429 |
11 |
11,342 |
5,597 |
16,939 |
1,539 |
16,526 |
221 |
6,701 |
15,836 |
413 |
352 |
95.8 |
85.2 |
22.5 |
0.5 |
23.0 |
... |
... |
... |
... |
|
28 |
Calicut do. |
20 |
16,200 |
8,351 |
24,551 |
1,228 |
23,927 |
368 |
5,969 |
22,642 |
624 |
438 |
94.7 |
70.2 |
... |
... |
... |
... |
||||||
|
29 |
Palghat do. |
13 |
12,518 |
6,952 |
19,470 |
1,497 |
18,626 |
342 |
5,135 |
17,092 |
844 |
440 |
91.8 |
52.1 |
... |
... |
... |
... |
||||||
|
Total of district ... |
2,464,154 |
429 |
44 |
40,060 |
20,900 |
60,960 |
1,385 |
59,079 |
931 |
17,805 |
55,570 |
1,881 |
1,230 |
94.1 |
65.4 |
22.5 |
0.5 |
23.0 |
40,331 |
16.3 |
2,633 |
1.0 |
||
Set display mode to: Large image | Zoom image | Transcription
Images and transcriptions on this page, including medium image downloads, may be used under the Creative Commons Attribution 4.0 International Licence unless otherwise stated. ![]()
| Permanent URL | https://digital.nls.uk/91175803 |
|---|
| Attribution and copyright: |
|
|---|
| Description | Covers 1877-1929. Details and appraises vaccination operations in the Madras Presidency. Describes manufacture and storage of lymph. Tables show particulars of vaccination. Success and mortality rates noted. Graphs included. |
|---|---|
| Shelfmark | IP/25/VA.3 |
| Additional NLS resources: | |
| Description | The Vaccination collection consists of 66 volumes dating from 1856 to 1933. Reports show how vaccination against smallpox was implemented in India. They reveal the shift from variolation, improved vaccination techniques, logistics of lymph supply, funding and staffing. They explore how the local population viewed and resisted western vaccination. |
|---|---|
| Description | The India Papers collection contains publications of the central (Imperial) Government and many Indian states. Most states came under British rule. Much of the collection dates from between the post-Mutiny re-organisation of the Indian Government and Indian Independence in 1947. Some items published in London by John Murray. |
|---|---|
| Shelfmark | India Papers |
| Additional NLS resources: | |