Medicine - Vaccination > 1877-1929 - Report on vaccination in the Madras Presidency > Report on vaccination in Madras 1877-1894 > 1892-1893 - Report on vaccination in the Madras Presidency for the year 1892-93
(350) Page 14
Download files
Individual page:
Thumbnail gallery: Grid view | List view

14 VACCINATION REPORT.
|
Districts. |
Number of dispensaries. |
Number vaccinated. |
Number vaccinated |
Percentage of |
Average number vaccinated |
Success of primary |
|||||||||
|
Primary vaccination. |
Re-vaccination. |
Total. |
Primary vaccination. |
Re-vaccination. |
Total. |
Primary vaccination. |
Re-vaccination. |
Total. |
Under one year. |
Above one and under |
Above six years. |
||||
|
Anantapur. |
1890-91 ... |
9 |
582 |
37 |
619 |
547 |
17 |
564 |
94.0 |
45.9 |
91.1 |
69 |
254 |
204 |
89 |
|
1891-92 ... |
9 |
641 |
2 |
643 |
603 |
... |
603 |
94.7 |
... |
94.7 |
71 |
285 |
290 |
28 |
|
|
1892-93 ... |
10 |
628 |
18 |
646 |
570 |
10 |
580 |
90.8 |
55.5 |
89.8 |
65 |
227 |
322 |
31 |
|
|
Bellary ... |
1890-91 ... |
18 |
1,243 |
793 |
2,036 |
1,108 |
736 |
1,844 |
89.1 |
92.9 |
90.6 |
113 |
682 |
387 |
39 |
|
1891-92 ... |
19 |
1,178 |
840 |
2,018 |
1,091 |
217 |
1,308 |
92.6 |
25.8 |
64.8 |
106 |
634 |
439 |
18 |
|
|
1892-93... |
19 |
1,409 |
66 |
1,475 |
1,254 |
45 |
1,299 |
89.0 |
68.2 |
88.1 |
82 |
510 |
509 |
235 |
|
|
Chingleput. |
1890-91... |
16 |
4,666 |
129 |
4,675 |
4,236 |
72 |
4,508 |
90.8 |
55.8 |
89.8 |
292 |
1,352 |
2,284 |
600 |
|
1891-92 ... |
16 |
4,527 |
134 |
4,661 |
4,155 |
91 |
4,246 |
91.8 |
66.4 |
91.1 |
291 |
1,456 |
2,058 |
641 |
|
|
1892-93 ... |
16 |
4,434 |
166 |
4,600 |
4,045 |
67 |
4,112 |
91.2 |
40.4 |
89.4 |
287 |
1,441 |
1,889 |
715 |
|
|
Coimbatore |
1890-91... |
16 |
939 |
18 |
957 |
824 |
17 |
841 |
85.7 |
93.3 |
87.9 |
60 |
230 |
432 |
162 |
|
1891-92... |
17 |
965 |
55 |
1,020 |
784 |
36 |
820 |
81.2 |
65.5 |
80.4 |
60 |
241 |
382 |
161 |
|
|
1892-93 ... |
20 |
1,280 |
49 |
1,329 |
940 |
29 |
969 |
73.4 |
59.2 |
72.2 |
66 |
272 |
478 |
190 |
|
|
Cuddapah... |
1890-91 ... |
13 |
943 |
76 |
1,019 |
747 |
25 |
772 |
79.2 |
33.3 |
75.8 |
78 |
186 |
351 |
210 |
|
1891-92... |
13 |
1,052 |
12 |
1,064 |
829 |
1 |
830 |
78.8 |
8.3 |
78.0 |
82 |
197 |
454 |
178 |
|
|
1892-93 ... |
13 |
538 |
38 |
576 |
473 |
15 |
488 |
87.9 |
39.5 |
84.7 |
44 |
93 |
234 |
146 |
|
|
Ganjám ... |
1890-91 ... |
14 |
472 |
31 |
503 |
351 |
21 |
372 |
74.4 |
67.7 |
74.0 |
36 |
38 |
194 |
119 |
|
1891-92 ... |
14 |
2,098 |
170 |
2,268 |
914 |
85 |
999 |
43.6 |
50.0 |
44.0 |
162 |
123 |
540 |
251 |
|
|
1892-93 ... |
17 |
1,867 |
27 |
1,894 |
1,248 |
11 |
1,259 |
66.8 |
40.7 |
66.5 |
111 |
295 |
638 |
415 |
|
|
Gódávari ... |
1890-91 ... |
18 |
1,476 |
11 |
1,487 |
1,171 |
5 |
1,176 |
79.3 |
45.4 |
79.7 |
83 |
82 |
665 |
424 |
|
1891-92 ... |
21 |
1,985 |
95 |
2,080 |
1,523 |
75 |
1,598 |
76.7 |
78.9 |
76.8 |
99 |
137 |
912 |
474 |
|
|
1892-93 ... |
20 |
2,698 |
119 |
2,817 |
2,005 |
64 |
2,069 |
74.3 |
53.8 |
73.4 |
141 |
151 |
1,083 |
771 |
|
|
Kistna ... |
1890-91... |
21 |
767 |
11 |
778 |
646 |
8 |
654 |
84.2 |
72.7 |
84.1 |
37 |
47 |
431 |
168 |
|
1891-92 ... |
22 |
1,015 |
29 |
1,044 |
785 |
15 |
800 |
77.3 |
51.7 |
76.6 |
47 |
86 |
396 |
303 |
|
|
1892-93... |
22 |
1,026 |
44 |
1,070 |
915 |
39 |
954 |
89.2 |
88.6 |
89.1 |
59 |
180 |
444 |
391 |
|
|
Kurnool ... |
1890-91 ... |
18 |
2,589 |
840 |
3,429 |
1,880 |
735 |
2,615 |
72.6 |
87.5 |
76.3 |
190 |
269 |
926 |
685 |
|
1891-92... |
18 |
845 |
304 |
1,149 |
701 |
248 |
949 |
83.0 |
81.6 |
82.6 |
64 |
124 |
364 |
213 |
|
|
1892-93 ... |
18 |
824 |
179 |
1,003 |
669 |
164 |
833 |
81.1 |
91.6 |
83.1 |
59 |
150 |
287 |
232 |
|
|
Madras |
1890-91 ... |
4 |
... |
... |
... |
... |
... |
... |
... |
... |
... |
... |
... |
... |
... |
|
1891-92... |
4 |
... |
... |
... |
... |
... |
... |
... |
... |
... |
... |
... |
... |
... |
|
|
1892-93 ... |
4 |
... |
... |
... |
... |
... |
... |
... |
... |
... |
... |
... |
... |
... |
|
|
Madura ... |
1890-91 ... |
36 |
4,342 |
431 |
4,773 |
3,701 |
232 |
3,933 |
85.2 |
53.8 |
82.4 |
133 |
788 |
2,462 |
451 |
|
1891-92 ... |
41 |
4,799 |
413 |
5,212 |
3,702 |
237 |
3,939 |
77.1 |
57.4 |
75.6 |
127 |
1,058 |
2,119 |
525 |
|
|
1892-93 ... |
41 |
2,575 |
271 |
2,846 |
1,942 |
166 |
2,108 |
75.6 |
61.3 |
74.1 |
71 |
639 |
1,133 |
170 |
|
|
Malabar ... |
1890-91 ... |
22 |
727 |
43 |
770 |
560 |
29 |
589 |
77.0 |
67.4 |
76.5 |
35 |
24 |
154 |
282 |
|
1891-92... |
23 |
1,401 |
42 |
1,443 |
1,064 |
27 |
1,091 |
75.9 |
64.3 |
75.7 |
63 |
102 |
372 |
590 |
|
|
1892-93 ... |
24 |
1,151 |
65 |
1,216 |
871 |
29 |
900 |
75.7 |
44.6 |
74.0 |
61 |
49 |
234 |
588 |
|
|
Nellore ... |
1890-91... |
25 |
1,694 |
29 |
1,723 |
1,434 |
11 |
1,445 |
84.6 |
37.9 |
83.3 |
69 |
149 |
962 |
323 |
|
1891-92 ... |
26 |
3,535 |
45 |
3,580 |
3,190 |
30 |
3,220 |
90.2 |
66.7 |
89.9 |
138 |
381 |
2,056 |
753 |
|
|
1892-93... |
27 |
910 |
7 |
917 |
793 |
5 |
798 |
87.1 |
71.4 |
87.0 |
46 |
97 |
513 |
183 |
|
|
Nílgiris ... |
1890-91 ... |
4 |
100 |
66 |
166 |
92 |
61 |
153 |
92.0 |
92.4 |
92.2 |
41 |
19 |
21 |
52 |
|
1891-92 .. |
4 |
87 |
333 |
420 |
70 |
284 |
354 |
80.4 |
85.3 |
84.3 |
105 |
1 |
24 |
45 |
|
|
1892-93... |
3 |
29 |
... |
29 |
28 |
... |
28 |
96.6 |
... |
96.6 |
14 |
4 |
7 |
17 |
|
|
North |
1890-91 ... |
20 |
2,532 |
191 |
2,723 |
2,205 |
115 |
2,320 |
87.0 |
60.2 |
85.2 |
136 |
403 |
1,366 |
436 |
|
1891-92 ... |
20 |
2,945 |
144 |
3,089 |
2,641 |
90 |
2,731 |
89.7 |
61.1 |
88.4 |
154 |
628 |
1,526 |
487 |
|
|
1892-93 ... |
20 |
2,553 |
34 |
2,587 |
2,385 |
27 |
2,412 |
93.4 |
79.4 |
93.2 |
129 |
539 |
1,502 |
344 |
|
|
Salem ... |
1890-91 ... |
24 |
1,626 |
88 |
1,714 |
1,445 |
68 |
1,513 |
88.8 |
77.2 |
88.2 |
71 |
269 |
1,016 |
160 |
|
1891-92 .. |
23 |
2,423 |
43 |
2,466 |
2,079 |
36 |
2,115 |
85.8 |
83.7 |
85.7 |
107 |
566 |
1,260 |
253 |
|
|
1892-93 ... |
24 |
2,844 |
296 |
3,140 |
2,400 |
140 |
2,540 |
84.4 |
47.3 |
80.9 |
143 |
668 |
1,415 |
317 |
|
|
South |
1890-91 .. |
21 |
2,232 |
56 |
2,288 |
1,900 |
29 |
1,929 |
85.1 |
51.8 |
84.3 |
109 |
423 |
1,132 |
345 |
|
1891-92 .. |
23 |
1,916 |
74 |
1,990 |
1,594 |
20 |
1,614 |
83.2 |
27.0 |
81.1 |
86 |
423 |
984 |
187 |
|
|
1892-93... |
24 |
811 |
17 |
828 |
664 |
9 |
673 |
81.9 |
52.9 |
81.3 |
36 |
186 |
400 |
78 |
|
|
South |
1890-91 ... |
15 |
483 |
26 |
509 |
366 |
10 |
376 |
75.8 |
38.5 |
73.9 |
34 |
38 |
221 |
107 |
|
1891-92 ... |
15 |
590 |
68 |
658 |
474 |
52 |
526 |
80.3 |
76.5 |
79.9 |
44 |
51 |
256 |
167 |
|
|
1892-93 ... |
17 |
1,002 |
167 |
1,169 |
875 |
130 |
1,005 |
87.3 |
77.8 |
86.0 |
78 |
61 |
490 |
324 |
|
|
Tanjore ... |
1890-91 ... |
38 |
6,219 |
585 |
6,804 |
5,239 |
450 |
5,689 |
84.2 |
76.9 |
83.6 |
179 |
647 |
3,293 |
1,299 |
|
1891-92 ... |
36 |
6,086 |
644 |
6,730 |
5,002 |
399 |
5,401 |
82.2 |
62.0 |
80.3 |
187 |
587 |
3,150 |
1,265 |
|
|
1892-93 ... |
37 |
4,740 |
539 |
5,279 |
4,218 |
392 |
4,610 |
89.0 |
72.7 |
87.1 |
165 |
488 |
2,617 |
1,113 |
|
|
Tinnevelly. |
1890-91 ... |
24 |
1,598 |
40 |
1,638 |
1,396 |
15 |
1,411 |
87.3 |
37.5 |
86.1 |
68 |
126 |
867 |
403 |
|
1891-92... |
25 |
1,592 |
87 |
1,679 |
1,425 |
46 |
1,471 |
89.5 |
52.9 |
87.6 |
67 |
136 |
796 |
493 |
|
|
1892-93... |
25 |
1,438 |
108 |
1,546 |
1,150 |
64 |
1,214 |
80.0 |
59.2 |
78.5 |
62 |
158 |
630 |
362 |
|
|
Trichino- |
1890-91... |
15 |
1,619 |
97 |
1,716 |
1,422 |
86 |
1,508 |
87.8 |
68.0 |
87.9 |
114 |
163 |
947 |
312 |
|
1891-92 .. |
15 |
1,287 |
105 |
1,392 |
1,188 |
48 |
1,236 |
92.3 |
95.7 |
88.7 |
93 |
119 |
893 |
176 |
|
|
1892-93 ... |
15 |
1,164 |
74 |
1,238 |
1,024 |
38 |
1,062 |
88.0 |
51.4 |
85.8 |
83 |
225 |
627 |
172 |
|
|
Vizaga- |
1890-91... |
19 |
2,039 |
197 |
2,236 |
1,892 |
143 |
2,035 |
92.8 |
72.6 |
91.1 |
118 |
427 |
1,025 |
440 |
|
1891-92... |
23 |
2,564 |
182 |
2,746 |
2,290 |
130 |
2,420 |
89.3 |
71.4 |
88.1 |
119 |
601 |
1,173 |
516 |
|
|
1892-93... |
23 |
2,037 |
99 |
2,136 |
1,817 |
52 |
1,869 |
89.2 |
52.5 |
87.5 |
97 |
289 |
990 |
538 |
|
|
Total ... |
1890-91... |
410 |
38,888 |
3,795 |
42,683 |
33,162 |
2,885 |
36,047 |
85.6 |
76.0 |
84.5 |
104 |
6,616 |
19,340 |
7,206 |
|
1891-92 ... |
427 |
43,531 |
3,821 |
47,352 |
36,104 |
2,167 |
38,271 |
82.9 |
56.7 |
80.8 |
111 |
7,936 |
20,444 |
7,724 |
|
|
1892-93... |
439 |
35,958 |
2,383 |
38,341 |
30,292 |
1,496 |
31,788 |
84.2 |
62.8 |
82.9 |
87 |
6,722 |
16,442 |
7,128 |
|
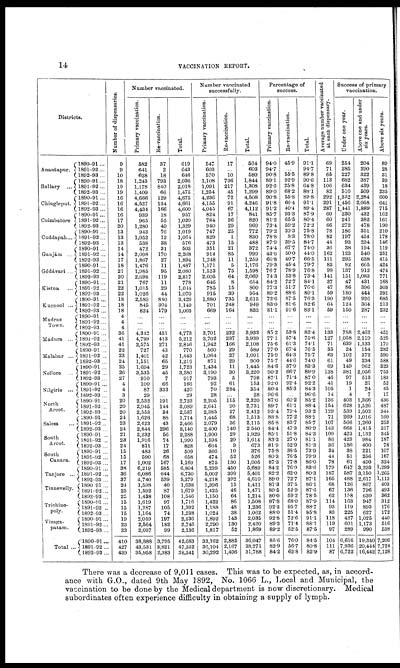
There was a decrease of 9,011 cases. This was to be expected, as, in accord-
ance with G.O., dated 9th May 1892, No. 1066 L., Local and Municipal, the
vaccination to be done by the Medical department is now discretionary. Medical
subordinates often experience difficulty in obtaining a supply of lymph.
Set display mode to: Large image | Zoom image | Transcription
Images and transcriptions on this page, including medium image downloads, may be used under the Creative Commons Attribution 4.0 International Licence unless otherwise stated. ![]()
| Permanent URL | https://digital.nls.uk/91175755 |
|---|
| Attribution and copyright: |
|
|---|


