Medicine - Vaccination > 1877-1929 - Report on vaccination in the Madras Presidency > Report on vaccination in Madras 1877-1894 > 1891-1892 - Report on vaccination in the Madras Presidency for the year 1891-92
(306) Page 26
Download files
Individual page:
Thumbnail gallery: Grid view | List view

26 APPENDIX.
A—VACCINE DEPARTMENT.
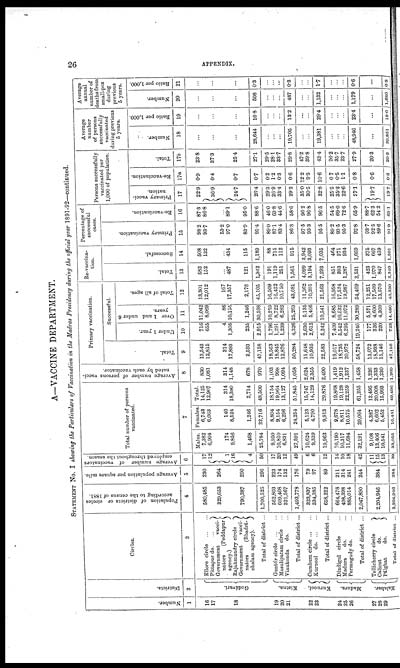
STATEMENT No. I showing the Particulars of Vaccination in the Madras Presidency during the official year 1891-92—continued.
|
Number. |
Districts. |
Circles. |
Population of districts or circles |
Average population per square mile. |
Average number of vaccinators |
Total number of persons |
Average number of persons vacci- |
Primary vaccination. |
Re-vaccina- |
Percentage of |
Persons successfully |
Average |
Average |
|||||||||||
|
Total. |
Successful. |
Total. |
Successful. |
Primary vaccination. |
Re-vaccination. |
|||||||||||||||||||
|
Under 1 year. |
Over 1 and under 6 |
Total of all ages. |
||||||||||||||||||||||
|
Primary vacci- |
Re-vaccination. |
Total. |
Number. |
Ratio per 1,000. |
Number. |
Ratio per 1,000. |
||||||||||||||||||
|
1 |
2 |
3 |
4 |
5 |
6 |
7 |
8 |
9 |
10 |
11 |
12 |
13 |
14 |
15 |
16 |
17 |
17a |
17b |
18 |
19 |
20 |
21 |
||
|
Males. |
Females. |
Total. |
||||||||||||||||||||||
|
16 |
Godávari. |
Ellore circle ... ... |
580,485 |
230 |
17 |
7,382 |
6,743 |
14,125 |
830 |
13,543 |
716 |
11,042 |
13,301 |
582 |
508 |
98.2 |
87.3 |
22.9 |
0.9 |
23.8 |
... |
... |
... |
... |
|
17 |
Pittapur do. ... |
329,653 |
264 |
12 |
6,904 |
6,063 |
12,967 |
1,081 |
12,815 |
655 |
8,069 |
12,012 |
152 |
132 |
93.7 |
86.8 |
36.9 |
0.4 |
37.3 |
... |
... |
... |
... |
|
|
Government vacci- |
1 |
174 |
140 |
314 |
314 |
314 |
4 |
86 |
167 |
... |
... |
53.2 |
... |
|||||||||||
|
18 |
Rajahmundry circle |
790,387 |
290 |
16 |
9,856 |
8,524 |
18,380 |
1,148 |
17,893 |
1,305 |
10,155 |
17,357 |
487 |
434 |
97.0 |
89.1 |
24.7 |
0.7 |
25.4 |
... |
... |
... |
... |
|
|
Government vacci- |
4 |
1,468 |
1,246 |
2,714 |
678 |
2,593 |
235 |
1,246 |
2,178 |
121 |
115 |
83.9 |
95.0 |
|||||||||||
|
Total of district ... |
1,700,525 |
296 |
50 |
25,784 |
22,716 |
48,500 |
970 |
47,158 |
2,915 |
30,598 |
45,105 |
1,342 |
1,189 |
95.4 |
88.6 |
26.4 |
0.7 |
27.1 |
28,644 |
16.8 |
508 |
0.3 |
||
|
19 |
Kistna. |
Guntúr circle ... ... |
562,803 |
223 |
17 |
9,950 |
8,804 |
18,754 |
1,103 |
18,563 |
1,796 |
10,259 |
16,509 |
191 |
88 |
89.0 |
46.0 |
29.3 |
0.2 |
29.5 |
... |
... |
... |
... |
|
20 |
Masulipatam circle ... |
609,408 |
174 |
20 |
10,810 |
9,154 |
19,964 |
998 |
18,845 |
1,291 |
8,722 |
16,422 |
1,119 |
715 |
87.1 |
63.8 |
26.9 |
1.2 |
28.1 |
... |
... |
... |
... |
|
|
21 |
Vinukonda do. ... |
321,567 |
132 |
12 |
6,831 |
6,296 |
13,127 |
1,094 |
12,876 |
1,239 |
6,282 |
10,750 |
251 |
112 |
83.4 |
44.6 |
33.4 |
0.3 |
33.7 |
... |
... |
... |
... |
|
|
Total of district ... |
1,493,778 |
176 |
49 |
27,591 |
24,254 |
51,845 |
1,058 |
50,284 |
4,326 |
25,263 |
43,681 |
1,561 |
915 |
86.8 |
58.6 |
29.2 |
0.6 |
29.8 |
19,705 |
13.2 |
487 |
0.3 |
||
|
22 |
Kurnool. |
Cumbum circle ... ... |
323,837 |
79 |
6 |
10,624 |
5,123 |
15,747 |
2,624 |
11,648 |
2,630 |
5,135 |
11,362 |
4,099 |
3,942 |
97.5 |
96.2 |
35.0 |
12.2 |
47.2 |
... |
... |
... |
... |
|
23 |
Kurnool do. ... ... |
334,385 |
97 |
6 |
9,339 |
4,790 |
14,129 |
2,355 |
10,935 |
2,612 |
5,406 |
10,201 |
3,194 |
3,093 |
93.3 |
96.8 |
30.5 |
9.3 |
39.8 |
... |
... |
... |
... |
|
|
Total of district ... |
658,222 |
89 |
12 |
19,963 |
9,913 |
29,876 |
2,490 |
22,583 |
5,242 |
10,541 |
21,563 |
7,293 |
7,035 |
95.5 |
96.5 |
32.8 |
10.6 |
43.4 |
19,381 |
29.4 |
1,132 |
1.7 |
||
|
24 |
Madura. |
Dindigul circle ... |
664,478 |
211 |
14 |
10,190 |
9,678 |
19,868 |
1,419 |
19,017 |
7,409 |
8,685 |
16,958 |
851 |
464 |
89.2 |
54.5 |
25.5 |
0.7 |
26.2 |
... |
... |
... |
... |
|
25 |
Madura do. ... |
498,398 |
314 |
10 |
10,317 |
8,811 |
19,128 |
1,912 |
18,735 |
5,542 |
10,532 |
17,524 |
393 |
271 |
93.5 |
69.0 |
35.2 |
0.5 |
35.7 |
... |
... |
... |
... |
|
|
26 |
Permagndy do. ... |
885,014 |
241 |
18 |
11,684 |
10,575 |
22,259 |
1,237 |
20,972 |
6,295 |
11,072 |
19,987 |
1,287 |
934 |
95.3 |
72.6 |
22.6 |
1.1 |
23.7 |
... |
... |
... |
... |
|
|
Total of district ... |
2,047,890 |
244 |
42 |
32,191 |
29,064 |
61,255 |
1,458 |
58,724 |
19,246 |
30,289 |
54,469 |
2,531 |
1,669 |
92.8 |
65.9 |
27.1 |
0.8 |
27.9 |
48,946 |
23.4 |
1,179 |
0.6 |
||
|
27 |
Malabar. |
Tellicherry circle |
2,204,946 |
384 |
11 |
9,108 |
4,387 |
13,495 |
1,226 |
13,072 |
177 |
5,571 |
12,251 |
423 |
375 |
93.7 |
88.7 |
19.7 |
0.6 |
20.3 |
... |
... |
... |
... |
|
28 |
Calicut do. |
15 |
13,406 |
6,602 |
20,008 |
1,333 |
18,938 |
326 |
4,600 |
17,509 |
1,070 |
667 |
92.5 |
62.3 |
||||||||||
|
29 |
Pálghat do. |
13 |
10,541 |
5,452 |
15,993 |
1,230 |
15,146 |
220 |
4,309 |
13,570 |
847 |
459 |
89.6 |
54.2 |
||||||||||
|
Total of district ... |
2,204,946 |
384 |
39 |
33,055 |
16,441 |
49,496 |
1,269 |
47,156 |
728 |
14,480 |
43,330 |
2,340 |
1,601 |
91.9 |
63.1 |
19.7 |
0.6 |
20.3 |
39,851 |
18.0 |
1,680 |
0.8 |
||
Set display mode to: Large image | Zoom image | Transcription
Images and transcriptions on this page, including medium image downloads, may be used under the Creative Commons Attribution 4.0 International Licence unless otherwise stated. ![]()
| Permanent URL | https://digital.nls.uk/91175623 |
|---|
| Attribution and copyright: |
|
|---|


