Medicine - Vaccination > 1877-1929 - Report on vaccination in the Madras Presidency > Report on vaccination in Madras 1877-1894 > 1891-1892 - Report on vaccination in the Madras Presidency for the year 1891-92
(292) Page 12
Download files
Individual page:
Thumbnail gallery: Grid view | List view

12 VACCINATION REPORT.
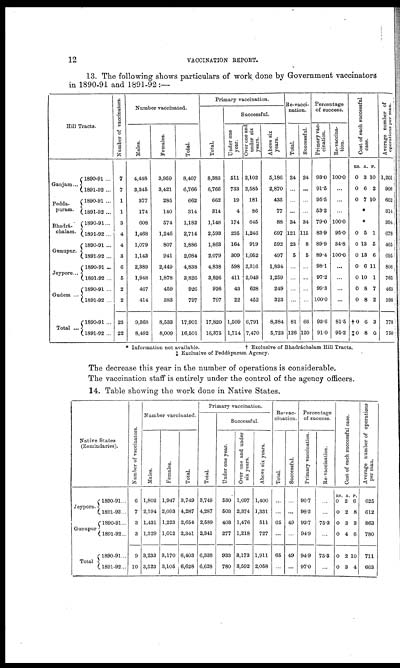
13. The following shows particulars of work done by Government vaccinators
in 1890-91 and 1891-92:—
|
Hill Tracts. |
Number of vaccinators. |
Number vaccinated. |
Primary vaccination. |
Re-vacci- |
Percentage |
Cost of each successful |
Average number of |
||||||||||
|
Total. |
Successful. |
||||||||||||||||
|
Males. |
Females. |
Total. |
Under one |
Over one and |
Above six |
Total. |
Successful. |
Primary vac- |
Re-vaccina- |
||||||||
|
RS. |
A. |
P. |
|||||||||||||||
|
Ganjam... |
1890-91 ... |
7 |
4,448 |
3,959 |
8,407 |
8,383 |
511 |
2,102 |
5,186 |
24 |
24 |
93.0 |
100.0 |
0 |
3 |
10 |
1,201 |
|
1891-92... |
7 |
3,345 |
3,421 |
6,766 |
6,766 |
733 |
2,585 |
2,870 |
... |
... |
91.5 |
... |
0 |
6 |
2 |
966 |
|
|
Pedda- |
1890-91 ... |
1 |
377 |
285 |
662 |
662 |
19 |
181 |
435 |
... |
... |
95.5 |
... |
0 |
7 |
10 |
662 |
|
1891-92 ... |
1 |
174 |
140 |
314 |
314 |
4 |
86 |
77 |
... |
... |
53.2 |
... |
* |
314 |
|||
|
Bhadrá- |
1890-91... |
3 |
608 |
574 |
1,182 |
1,148 |
174 |
645 |
88 |
34 |
34 |
79.0 |
100.0 |
* |
394 |
||
|
1891-92 ... |
4 |
1,468 |
1,246 |
2,714 |
2,593 |
235 |
1,246 |
697 |
121 |
115 |
83.9 |
95.0 |
0 |
5 |
1 |
678 |
|
|
Gunupur. |
1890-91 ... |
4 |
1,079 |
807 |
1,886 |
1,863 |
164 |
919 |
592 |
23 |
8 |
89.9 |
34.8 |
0 |
13 |
5 |
465 |
|
1891-92 ... |
3 |
1,143 |
941 |
2,084 |
2,079 |
309 |
1,052 |
497 |
5 |
5 |
89.4 |
100.0 |
0 |
13 |
6 |
695 |
|
|
Jeypore... |
1890-91 ... |
6 |
2,389 |
2,449 |
4,838 |
4,838 |
598 |
2,316 |
1,834 |
... |
... |
98.1 |
... |
0 |
6 |
11 |
806 |
|
1891-92 ... |
5 |
1,948 |
1,878 |
3,826 |
3,826 |
411 |
2,049 |
1,259 |
... |
... |
97.2 |
... |
0 |
10 |
1 |
765 |
|
|
Gudem ... |
1890-91 ... |
2 |
467 |
459 |
926 |
926 |
43 |
628 |
249 |
... |
... |
99.3 |
... |
0 |
8 |
7 |
463 |
|
1891-92 ... |
2 |
414 |
383 |
797 |
797 |
22 |
452 |
323 |
... |
... |
100.0 |
... |
0 |
8 |
2 |
398 |
|
|
Total ... |
1890-91 ... |
23 |
9,368 |
8,533 |
17,901 |
17,820 |
1,509 |
6,791 |
8,384 |
81 |
66 |
93.6 |
81.5 |
†0 |
6 |
3 |
778 |
|
1891-92 ... |
22 |
8,492 |
8,009 |
16,501 |
16,375 |
1,714 |
7,470 |
5,723 |
126 |
120 |
91.0 |
95.2 |
‡0 |
8 |
0 |
750 |
|
* Information not available. † Exclusive of Bhadráchalam Hill Tracts.
‡ Exclusive of Peddápuram Agency.
The decrease this year in the number of operations is considerable.
The vaccination staff is entirely under the control of the agency officers.
14. Table showing the work done in Native States.
|
Native States |
Number of vaccinators. |
Number vaccinated. |
Primary vaccination. |
Re-vac- |
Percentage |
Cost of each successful case. |
Average number of operations |
||||||||||
|
Total. |
Successful. |
||||||||||||||||
|
Males. |
Females. |
Total. |
Under one year. |
Over one and under |
Above six years. |
Total |
Successful. |
Primary vaccination. |
Re - vaccination. |
||||||||
|
RS. |
A. |
P. |
|||||||||||||||
|
Jeypore. |
1890-91... |
6 |
1,802 |
1,947 |
3,749 |
3,749 |
530 |
1,697 |
1,400 |
... |
... |
96.7 |
0 |
2 |
6 |
625 |
|
|
1891-92... |
7 |
2,194 |
2,093 |
4,287 |
4,287 |
503 |
2,374 |
1,331 |
... |
... |
98.2 |
... |
0 |
2 |
8 |
612 |
|
|
Gunupur |
1890-91... |
3 |
1,431 |
1,223 |
2,654 |
2,589 |
403 |
1,476 |
511 |
65 |
49 |
92.7 |
75.3 |
0 |
3 |
3 |
863 |
|
1891-92... |
3 |
1,329 |
1,012 |
2,341 |
2,341 |
277 |
1,218 |
727 |
... |
94.9 |
0 |
4 |
6 |
780 |
|||
|
Total |
1890-91... |
9 |
3,233 |
3,170 |
6,403 |
6,338 |
933 |
3,173 |
1,911 |
65 |
49 |
94.9 |
75.3 |
0 |
2 |
10 |
711 |
|
1891-92... |
10 |
3,523 |
3,105 |
6,628 |
6,628 |
780 |
3,592 |
2,058 |
... |
... |
97.0 |
... |
0 |
3 |
4 |
663 |
|
Set display mode to: Large image | Zoom image | Transcription
Images and transcriptions on this page, including medium image downloads, may be used under the Creative Commons Attribution 4.0 International Licence unless otherwise stated. ![]()
| Permanent URL | https://digital.nls.uk/91175581 |
|---|
| Attribution and copyright: |
|
|---|


