Medicine - Vaccination > 1878-1880 - Annual report on vaccination in Mysore > Annual report on vaccination in Mysore, 1878-1879 > Annual report on vaccination in Mysore, 1878-79
(9) Page 5
Download files
Individual page:
Thumbnail gallery: Grid view | List view

5
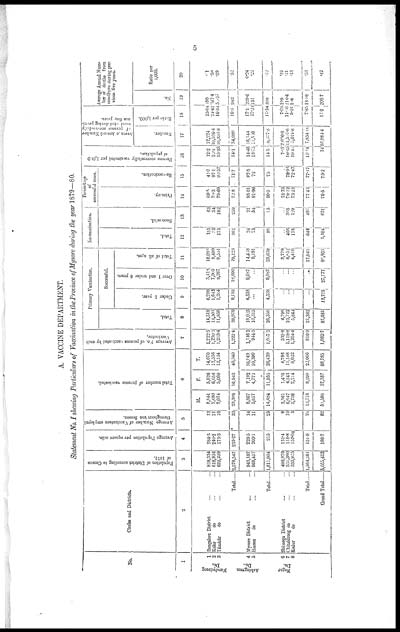
A. VACCINE DEPARTMENT.
Statement No. I shewing Particulars of Vaccination in the Province of Mysore during the year 1879—80.
|
No. |
Circles and Districts. |
Population of District according to Census |
Average Population per square mile. |
Average Number of Vaccinators employed |
Total number of persons vaccinated. |
Average No. of persons vaccinated by each |
Primary Vaccination. |
Re-vaccination. |
Percentage |
Persons successfully vaccinated per 1,000 |
Average Annual Number |
Average Annual Num- |
||||||||||
|
Total. |
Successful. |
Total. |
Successful. |
Primary. |
Re-vaccination. |
|||||||||||||||||
|
Under 1 year. |
Over 1 and under 6 years. |
Total of all ages. |
||||||||||||||||||||
|
Number. |
Ratio per 1,000. |
No. |
Ratio per |
|||||||||||||||||||
|
1 |
2 |
3 |
4 |
5 |
6 |
7 |
8 |
9 |
10 |
11 |
12 |
13 |
14 |
15 |
16 |
17 |
18 |
19 |
20 |
|||
|
Nundydroog |
M. |
F. |
T. |
|||||||||||||||||||
|
1 |
Bangalore District ... ... |
828,354 |
284.3 |
12 |
8,844 |
5,826 |
14,670 |
1,222.5 |
14,519 |
6,288 |
3,418 |
10,093 |
151 |
63 |
69.5 |
41.7 |
12.2 |
12,224 |
15.64 |
190 |
.01 |
|
|
2 |
Kolar do ... ... |
618,954 |
240.2 |
11 |
7,480 |
6,056 |
13,536 |
1,230.5 |
13,501 |
1,643 |
7,005 |
9,499 |
35 |
34 |
70.3 |
97.1 |
22.2 |
10,536.4 |
24.42 |
347.4 |
.58 |
|
|
3 |
Túmkúr do ... ... |
632,239 |
175.3 |
10 |
7,074 |
5,060 |
12,134 |
1,213.4 |
11,959 |
1,264 |
8,267 |
9,581 |
175 |
162 |
79.69 |
92.57 |
15.33 |
10,333.8 |
16.34 |
50.27 |
.39 |
|
|
Ashtagram |
Total...... |
2,079,547 |
233.27 |
33 |
23,398 |
16,942 |
40,340 |
1,222.4 |
39,979 |
9,195 |
18,690 |
29,123 |
361 |
259 |
72.8 |
71.7 |
14.1 |
34,089 |
16.3 |
992 |
.52 |
|
|
4 |
Mysore District ... ... |
943,187 |
228.5 |
14 |
8,867 |
7,182 |
16,049 |
1,146.3 |
16,025 |
4,538 |
9,087 |
14,448 |
24 |
21 |
93.01 |
87.5 |
14.46 |
16,144 |
17.1 |
229.6 |
0.24 |
|
|
5 |
Hasan do ... ... |
668,417 |
203.1 |
11 |
5,617 |
4,773 |
10,390 |
944.5 |
10,315 |
... |
... |
9,191 |
75 |
54 |
91.96 |
72 |
13.75 |
11,560 |
17.24 |
151 |
.22 |
|
|
Total...... |
1,611,604 |
215 |
25 |
14,484 |
11,955 |
26,439 |
1,057.5 |
26,340 |
4,538 |
9,087 |
23,639 |
99 |
75 |
90.0 |
75 |
14.5 |
8,277.8 |
17.54 |
398 |
.22 |
||
|
Nagar |
6 |
Shimoga District ... ... |
498,976 |
131.4 |
9 |
3,361 |
1,435 |
4,796 |
532.8 |
4,796 |
... |
... |
3,779 |
... |
... |
78.79 |
... |
7.57 |
7,036.6 |
7.03 |
199 |
.19 |
|
7 |
Chitaldroog do ... ... |
531,360 |
118.8 |
10 |
6,647 |
4,541 |
11,188 |
1,118.8 |
10,722 |
... |
... |
8,852 |
466 |
368 |
79.12 |
78.96 |
16.65 |
11,507.6 |
11.50 |
216.4 |
.21 |
|
|
8 |
Kadur do ... ... |
333,925 |
157.04 |
5 |
3,708 |
2,314 |
6,022 |
1,204.4 |
5,844 |
... |
... |
4,410 |
178 |
129 |
73.23 |
72.47 |
10.41 |
5,019.8 |
5.01 |
136 |
.13 |
|
|
1,364,261 |
131.9 |
24 |
13,716 |
8,290 |
22,006 |
916.9 |
21,362 |
... |
... |
17,041 |
644 |
497 |
77.43 |
77.17 |
11.64 |
7,854.66 |
7.85 |
186.8 |
.58 |
|||
|
5,055,412 |
186.7 |
82 |
51,598 |
37,187 |
88,785 |
1,082.7 |
87,681 |
13,733 |
27,777 |
69,803 |
1,104 |
831 |
70.5 |
75.2 |
14 |
86,984.4 |
17.2 |
200.7 |
.42 |
|||
Set display mode to: Large image | Zoom image | Transcription
Images and transcriptions on this page, including medium image downloads, may be used under the Creative Commons Attribution 4.0 International Licence unless otherwise stated. ![]()
| Permanent URL | https://digital.nls.uk/91174202 |
|---|
| Attribution and copyright: |
|
|---|---|
| Description | Covers 1878-1880. Details and appraises vaccination operations in Mysore. |
|---|---|
| Shelfmark | IP/28/VA.3 |
| Additional NLS resources: | |


![[Page 4]](https://deriv.nls.uk/dcn4/9117/91174201.4.jpg)
