

Medicine - Vaccination > 1872-1903 - Report on vaccination in the Hyderabad Assigned Districts > Vaccination Hyderabad 1890-1903 > Notes on the annual returns of vaccination in the Hyderabad Assigned Districts for the year 1902-1903
(381) Page 7

Download files
Individual page:
Thumbnail gallery: Grid view | List view
( 7 )
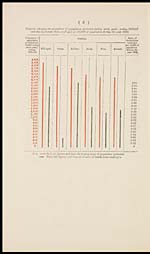
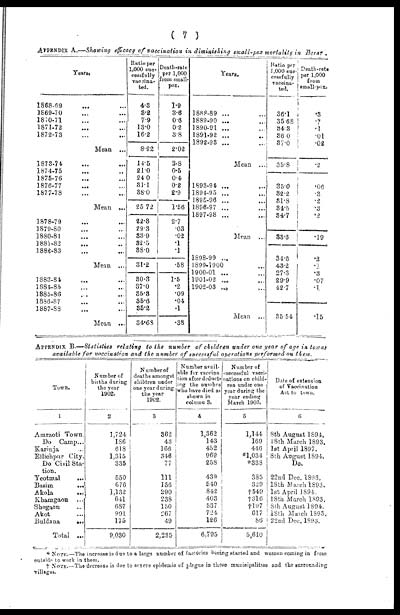
APPENDIX A.—Showing efficacy of vaccination in diminishing small-pox mortality in Berar.
|
Years. |
Ratio per |
Death-rate |
Years. |
Ratio per |
Death-rate |
|
1868-69 ... ... |
4.3 |
1.9 |
|||
|
1869-70 ... ... |
3.2 |
3.6 |
1888-89 ... ... |
36.1 |
.3 |
|
1870-71 ... ... |
7.9 |
0.6 |
1889-90 ... ... |
35.68 |
.7 |
|
1871-72 ... ... |
13.0 |
0.2 |
1890-91 ... ... |
34.3 |
.1 |
|
1872-73 ... ... |
16.2 |
3.8 |
1891-92 ... ... |
36.0 |
.01 |
|
1892-93 ... |
37.0 |
.02 |
|||
|
Mean ... |
8.92 |
2.02 |
|||
|
1873-74. ... ... |
14.5 |
3.8 |
Mean ... |
35.8 |
.2 |
|
1874-75 ... ... |
21.0 |
0.5 |
|||
|
1893-94 ... ... |
35.0 |
.06 |
|||
|
1875-76 ... ... |
24.0 |
0.4 |
|||
|
1876-77 ... ... |
31.1 |
0.2 |
|||
|
1877-78 ... ... |
38.0 |
2.9 |
1894-95 ... ... |
32.2 |
.3 |
|
1895-96 ... ... |
31.8 |
.2 |
|||
|
Mean ... |
25.72 |
1.56 |
|||
|
1896-97 ... ... |
34.5 |
.3 |
|||
|
1897-98 ... ... |
34.7 |
.2 |
|||
|
1878-79 ... ... |
22.3 |
2.7 |
|||
|
1879-80 ... ... |
29.3 |
.03 |
|||
|
Mean ... |
33.6 |
.19 |
|||
|
1880-81 ... ... |
33.9 |
.02 |
|||
|
1881-82 ... ... |
32.5 |
.1 |
|||
|
1898-99 ... |
34.6 |
.2 |
|||
|
1882-83 ... ... |
38.0 |
.1 |
|||
|
Mean ... |
31.2 |
.58 |
|||
|
1899-1900 ... |
43.2 |
.1 |
|||
|
1900-01 ... ... |
27.3 |
.3 |
|||
|
1883-84 ... ... |
30.3 |
1.5 |
|||
|
1901-02 ... ... |
29.9 |
.07 |
|||
|
1884-85 ... ... |
37.0 |
.2 |
1902-03 ... ... |
42.7 |
.1 |
|
1885-86 ... ... |
35.3 |
.09 |
|||
|
1886-87 ... ... |
35.6 |
.04 |
|||
|
Mean ... |
35.54 |
.15 |
|||
|
1887-88 ... ... |
35.2 |
.1 |
|||
|
Mean ... |
34.68 |
.38 |
APPENDIX B.—Statistics relating to the number of children under one year of age in towns
available for vaccination and the number of successful operations performed on them.
|
Town. |
Number of |
Number of |
Number avail- |
Number of |
Date of extension |
|
1 |
2 |
3 |
4 |
5 |
6 |
|
Amraoti Town. |
1,724 |
362 |
1,362 |
1,144 |
8th August 1894. |
|
Do. Camp... |
186 |
43 |
143 |
169 |
18th March 1893. |
|
Karinja ... |
618 |
166 |
452 |
446 |
1st April 1897. |
|
Ellichpur City. |
1,315 |
346 |
969 |
*1,034 |
8th August 1894. |
|
Do Civil Sta- |
335 |
77 |
258 |
*338 |
Do. |
|
Yeotmal ... |
550 |
111 |
439 |
385 |
22nd Dec. 1893. |
|
Basim ... |
676 |
136 |
540 |
329 |
18th March 1893. |
|
Akola ... |
1,132 |
290 |
842 |
†549 |
1st April 1894. |
|
Khamgaon ... |
641 |
238 |
403 |
†316 |
18th March 1893. |
|
Shegaon ... |
687 |
150 |
537 |
†197 |
8th August 1894. |
|
Akot ... |
991 |
267 |
724 |
617 |
18th Match 1893. |
|
Buldana ... |
175 |
49 |
126 |
86 |
22nd Dec. 1893. |
|
Total ... |
9,030 |
2,235 |
6,795 |
5,610 |
* NOTE.—The increase is due to a large number of factories beeing started and women coming in from
outside to work in them.
† NOTE.—The decrease is due to severe epidemic of plague in these municipalities and the surrounding
villages.
Set display mode to: Large image | Zoom image | Transcription
Images and transcriptions on this page, including medium image downloads, may be used under the Creative Commons Attribution 4.0 International Licence unless otherwise stated. ![]()
| Permanent URL | https://digital.nls.uk/91174044 |
|---|
| Attribution and copyright: |
|
|---|
| Description | Covers 1872-1903. Details and appraises vaccination operations in the Hyderabad Assigned Districts. Describes manufacture and storage of lymph. Tables show particulars of vaccination. Success and mortality rates noted. Colour diagrams included. |
|---|---|
| Shelfmark | IP/20/VA.3 |
| Additional NLS resources: | |
| Description | The Vaccination collection consists of 66 volumes dating from 1856 to 1933. Reports show how vaccination against smallpox was implemented in India. They reveal the shift from variolation, improved vaccination techniques, logistics of lymph supply, funding and staffing. They explore how the local population viewed and resisted western vaccination. |
|---|---|
| Description | The India Papers collection contains publications of the central (Imperial) Government and many Indian states. Most states came under British rule. Much of the collection dates from between the post-Mutiny re-organisation of the Indian Government and Indian Independence in 1947. Some items published in London by John Murray. |
|---|---|
| Shelfmark | India Papers |
| Additional NLS resources: | |