

Medicine - Vaccination > 1872-1903 - Report on vaccination in the Hyderabad Assigned Districts > Vaccination Hyderabad 1890-1903 > Notes on the annual returns of vaccination in the Hyderabad Assigned Districts for the year 1899-1900
(301) Page 3
Download files
Individual page:
Thumbnail gallery: Grid view | List view
( 3 )
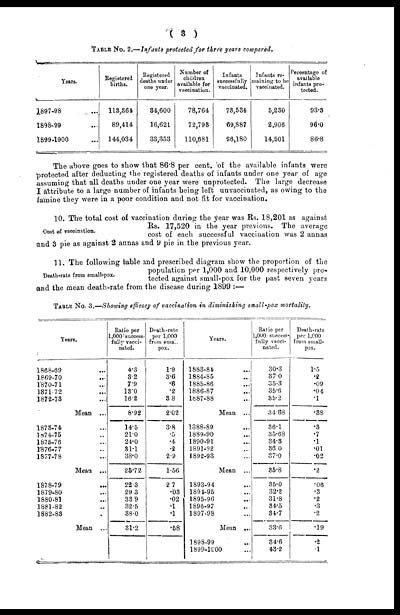
TABLE No 2.—Infants protected for three years compared.
|
Years. |
Registered |
Registered |
Number of |
Infants |
Infants re- |
Percentage of |
|
1897-98 ... |
113,364 |
34,600 |
78,764 |
73,534 |
5,230 |
93.3 |
|
1898-99 ... |
89,414 |
16,621 |
72,793 |
69,887 |
2,906 |
96.0 |
|
1899-1900 ... |
144,034 |
33,353 |
110,681 |
96,180 |
14,501 |
86.8 |
The above goes to show that 86.8 per cent. of the available infants were
protected after deducting the registered deaths of infants under one year of age
assuming that all deaths under one year were unprotected. The large decrease
I attribute to a large number of infants being left unvaccinated, as owing to the
famine they were in a poor condition and not fit for vaccination.
Cost of vaccination.
10. The total cost of vaccination during the year was Rs. 18,201 as against
Rs. 17,520 in the year previous. The average
cost of each successful vaccination was 2 annas
and 3 pie as against 2 annas and 9 pie in the previous year.
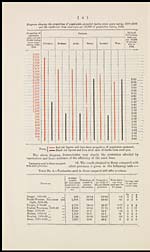
Death-rate from small-pox.
11. The following table and prescribed diagram show the proportion of the
population per 1,000 and 10,000 respectively pro-
tected against small-pox for the past seven years
and the mean death-rate from the disease during 1899 :—
TABLE No. 3.—Showing efficacy of vaccination in diminishing small-pox mortality.
|
Years. |
Ratio per |
Death-rate |
Years. |
Ratio per |
Death-rate |
|
1868-69 ... |
4.3 |
1.9 |
1888-84 ... |
30.3 |
1.5 |
|
1869-70 ... |
3.2 |
3.6 |
1884-85 ... |
37.0 |
.2 |
|
1870-71 ... |
7.9 |
.6 |
1885-86 ... |
35.3 |
.09 |
|
1871-72 ... |
13.0 |
.2 |
1886-87 ... |
35.6 |
.04 |
|
1872-73 ... |
16.2 |
3.8 |
1887-88 ... |
35.2 |
.1 |
|
Mean ... |
8.92 |
2.02 |
Mean ... |
34.68 |
.38 |
|
1873-74 ... |
14.5 |
3.8 |
1888-89 ... |
36.1 |
.3 |
|
1874-75 ... |
21.0 |
.5 |
1889-90 ... |
35.68 |
.7 |
|
1875-76 ... |
24.0 |
.4 |
1890-91 ... |
34.3 |
.1 |
|
1876-77 ... |
31.1 |
.2 |
1891-92 ... |
36.0 |
.01 |
|
1877-78 ... |
38.0 |
2.9 |
1892-93 ... |
37.0 |
.02 |
|
Mean ... |
25.72 |
1.56 |
Mean ... |
35.8 |
.2 |
|
1878-79 ... |
22.3 |
2.7 |
1893-94 ... |
35.0 |
.06 |
|
1879-80 ... |
29.3 |
.03 |
1894-95 ... |
32.2 |
.3 |
|
1880-81 ... |
33.9 |
.02 |
1895-96 ... |
31.8 |
.2 |
|
1881-82 ... |
32.5 |
.1 |
1896-97 ... |
34.5 |
.3 |
|
1882-83 ... |
38.0 |
.1 |
1897-98 ... |
34.7 |
.2 |
|
Mean ... |
31.2 |
.58 |
Mean ... |
33.6 |
.19 |
|
1898-99 ... |
34.6 |
.2 |
|||
|
1899-1900 ... |
43.2 |
.1 |
Set display mode to: Large image | Zoom image | Transcription
Images and transcriptions on this page, including medium image downloads, may be used under the Creative Commons Attribution 4.0 International Licence unless otherwise stated. ![]()
| Permanent URL | https://digital.nls.uk/91173804 |
|---|
| Attribution and copyright: |
|
|---|
| Description | Covers 1872-1903. Details and appraises vaccination operations in the Hyderabad Assigned Districts. Describes manufacture and storage of lymph. Tables show particulars of vaccination. Success and mortality rates noted. Colour diagrams included. |
|---|---|
| Shelfmark | IP/20/VA.3 |
| Additional NLS resources: | |
| Description | The Vaccination collection consists of 66 volumes dating from 1856 to 1933. Reports show how vaccination against smallpox was implemented in India. They reveal the shift from variolation, improved vaccination techniques, logistics of lymph supply, funding and staffing. They explore how the local population viewed and resisted western vaccination. |
|---|---|
| Description | The India Papers collection contains publications of the central (Imperial) Government and many Indian states. Most states came under British rule. Much of the collection dates from between the post-Mutiny re-organisation of the Indian Government and Indian Independence in 1947. Some items published in London by John Murray. |
|---|---|
| Shelfmark | India Papers |
| Additional NLS resources: | |