

Medicine - Vaccination > 1872-1903 - Report on vaccination in the Hyderabad Assigned Districts > Vaccination Hyderabad 1890-1903 > 1892-1893 - Notes on the annual returns of vaccination in the Hyderabad Assigned Districts for the year 1892-93
(98) Page 4
Download files
Individual page:
Thumbnail gallery: Grid view | List view
( 4 )
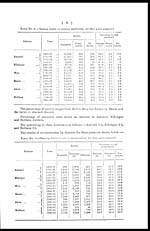
The percentage of success obtained varied from 26.9 in Basim district to
23.8 in Wun and 22 in Buldana; as compared with the record of the previous
years, there has been an improvement in recording these results in all the
districts.
The percentage of unknown cases varied from 12.6 in Wun to 45.3 in
Amraoti district. This large number of unverified cases in Amraoti district
was due to lack of supervision as already explained.
Class of those vaccinated.
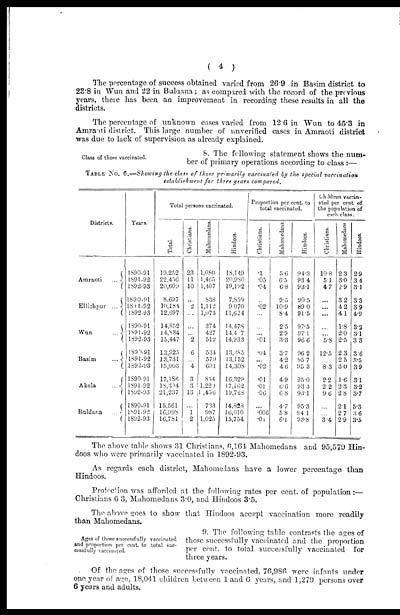
8. The following statement shows the num-
ber of primary operations according to class :—
TABLE No. 6.—Showing the class of those primarily vaccinated by the special vaccination
establishment for three years compared.
|
Years. |
Total persons vaccinated. |
Proportion per cent. to |
Children vaccin- |
||||||||
|
Districts. |
Total. |
Christians. |
Mahomedans. |
Hindoos. |
Christians. |
Mahomedans. |
Hindoos. |
Christians. |
Mahomedans. |
Hindoos. |
|
|
Amraoti ... |
1890-91 |
19,252 |
23 |
1,080 |
18,149 |
.1 |
5.6 |
94.3 |
10.8 |
2.3 |
2.9 |
|
1891-92 |
22,456 |
11 |
1,465 |
20,980 |
.05 |
6.5 |
93.4 |
5.1 |
3.0 |
3.4 |
|
|
1892-93 |
20,609 |
10 |
1,407 |
19,192 |
.04 |
6.8 |
93.1 |
4.7 |
2.9 |
3.1 |
|
|
Ellichpur ... |
1890-91 |
8,697 |
... |
838 |
7,859 |
... |
9.5 |
90.5 |
... |
3.2 |
3.3 |
|
1891-92 |
10,184 |
2 |
1,112 |
9,070 |
.02 |
10.9 |
89.0 |
... |
4.2 |
3.9 |
|
|
1892-93 |
12,697 |
... |
1,073 |
11,624 |
... |
8.4 |
91.5 |
... |
4.1 |
4.9 |
|
|
Wun ... |
1890-91 |
14,852 |
... |
374 |
14,478 |
... |
2.5 |
97.5 |
... |
1.8 |
3.2 |
|
1891-92 |
14,834 |
... |
427 |
14,4 7 |
... |
2.9 |
97.1 |
... |
2.0 |
3.1 |
|
|
1892-93 |
15,447 |
2 |
512 |
14,933 |
.01 |
3.3 |
96.6 |
5.8 |
2.5 |
3.3 |
|
|
Basim ... |
1890-91 |
13,925 |
6 |
534 |
13,385 |
.04 |
3.7 |
96.2 |
12.5 |
2.3 |
3.6 |
|
1891-92 |
13,731 |
... |
579 |
13,152 |
... |
4.2 |
95.7 |
... |
2.5 |
3.5 |
|
|
1892-93 |
15,003 |
4 |
691 |
14,308 |
.02 |
4.6 |
95.3 |
8.3 |
3.0 |
3.9 |
|
|
Akola ... |
1890-91 |
17,186 |
3 |
854 |
16,329 |
.01 |
49 |
95.0 |
2.2 |
1.6 |
3.1 |
|
1891-92 |
18,304 |
3 |
1,229 |
17,162 |
.01 |
6.6 |
93.3 |
2.2 |
2.3 |
3.2 |
|
|
1892-93 |
21,237 |
13 |
l ,456 |
19,768 |
.06 |
6.8 |
93.1 |
9.6 |
2.8 |
3.7 |
|
|
Buldana ... |
1890-91 |
15,561 |
... |
733 |
14,823 |
... |
4.7 |
95.3 |
... |
2.1 |
5.3 |
|
1891-92 |
16,998 |
1 |
987 |
16,010 |
.006 |
58 |
94.1 |
... |
2.7 |
3.6 |
|
|
1892-93 |
16,781 |
2 |
1,025 |
15,754 |
.01 |
6.1 |
93.8 |
3.4 |
2.9 |
3.5 |
|
The above table shows 31 Christians, 6,164 Mahomedans and 95,579 Hin-
doos who were primarily vaccinated in 1892-93.
As regards each district, Mahomedans have a lower percentage than
Hindoos.
Protection was afforded at the following rates per cent. of population:—
Christians 6.3, Mahomedans 3.0, and Hindoos 3.5.
The above goes to show that Hindoos accept vaccination more readily
than Mahomedans.
Ages of those successfully vaccinated
and proportion per cent. to total suc-
cessfully vaccinated.
9. The following table contrasts the ages of
those successfully vaccinated and the proportion
per cent. to total successfully vaccinated for
three years.
Of the ages of those successfully vaccinated, 76,986 were infants under
one year of age, 18,041 children between 1 and 6 years, and 1,279 persons over
6 years and adults.
Set display mode to: Large image | Zoom image | Transcription
Images and transcriptions on this page, including medium image downloads, may be used under the Creative Commons Attribution 4.0 International Licence unless otherwise stated. ![]()
| Permanent URL | https://digital.nls.uk/91173132 |
|---|
| Attribution and copyright: |
|
|---|
| Description | Covers 1872-1903. Details and appraises vaccination operations in the Hyderabad Assigned Districts. Describes manufacture and storage of lymph. Tables show particulars of vaccination. Success and mortality rates noted. Colour diagrams included. |
|---|---|
| Shelfmark | IP/20/VA.3 |
| Additional NLS resources: | |
| Description | The Vaccination collection consists of 66 volumes dating from 1856 to 1933. Reports show how vaccination against smallpox was implemented in India. They reveal the shift from variolation, improved vaccination techniques, logistics of lymph supply, funding and staffing. They explore how the local population viewed and resisted western vaccination. |
|---|---|
| Description | The India Papers collection contains publications of the central (Imperial) Government and many Indian states. Most states came under British rule. Much of the collection dates from between the post-Mutiny re-organisation of the Indian Government and Indian Independence in 1947. Some items published in London by John Murray. |
|---|---|
| Shelfmark | India Papers |
| Additional NLS resources: | |