Medicine - Vaccination > 1872-1903 - Report on vaccination in the Hyderabad Assigned Districts > Vaccination Hyderabad 1872-1889 > 1886-1887 - Report on vaccination in the Hyderabad Assigned Districts, for the official year 1886-87
(397) Page 5
Download files
Individual page:
Thumbnail gallery: Grid view | List view

( 5 )
A.—VACCINE DEPARTMENT.
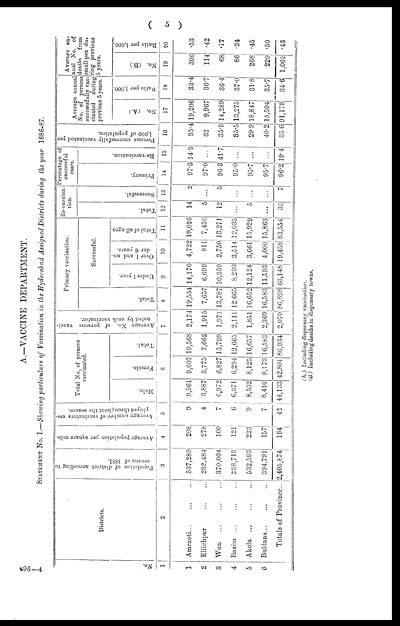
STATEMENT No. I.—Showing particulars of Vaccination in the Hyderabad Assigned Districts during the year 1886-87.
|
No. |
Districts. |
Population of district according to |
Average population per square mile. |
Average number of vaccinators em- |
Total No. of persons |
Average No. of persons vacci- |
Primary vaccination. |
Re-vaccina- |
Percentage of |
Persons successfully vaccinated per |
Average annual |
Average an- |
|||||||||
|
Total. |
Successful. |
Total. |
Successful. |
Primary. |
Re-vaccination. |
||||||||||||||||
|
Male. |
Female. |
Total. |
Under 1 year. |
Over 1 and un- |
Total of all ages. |
No. (A.) |
Ratio per 1,000. |
No. (B.) |
Ratio per 1,000. |
||||||||||||
|
1 |
2 |
3 |
4 |
5 |
6 |
7 |
8 |
9 |
10 |
11 |
12 |
13 |
14 |
15 |
16 |
17 |
18 |
19 |
20 |
||
|
1 |
Amraoti... ... ... |
537,289 |
208 |
9 |
9,961 |
9,607 |
19,568 |
2,174 |
19,554 |
14,170 |
4,722 |
19,026 |
14 |
2 |
97.3 |
14.3 |
35.4 |
19,206 |
33.4 |
306 |
.53 |
|
2 |
Ellichpur ... ... |
232,484 |
278 |
4 |
3,887 |
3,775 |
7,662 |
1,915 |
7,657 |
6,699 |
811 |
7,430 |
5 |
... |
97.0 |
... |
32 |
9,967 |
36.7 |
114 |
.42 |
|
3 |
Wun ... ... ... |
370,004 |
100 |
7 |
6,972 |
6,827 |
13,799 |
1,971 |
13,787 |
10,359 |
2,750 |
13,271 |
12 |
5 |
96.3 |
41.7 |
35.9 |
14,289 |
36.4 |
68 |
.17 |
|
4 |
Basim ... ... ... |
338,713 |
121 |
6 |
6,371 |
6,294 |
12,665 |
2,111 |
12,665 |
8,293 |
3,514 |
12,035 |
... |
... |
95.0 |
... |
35.5 |
13,275 |
37.0 |
86 |
.24 |
|
5 |
Akola ... ... ... |
532,593 |
223 |
9 |
8,532 |
8,125 |
16,657 |
1,851 |
16,652 |
12,124 |
3,661 |
15,929 |
5 |
... |
95.7 |
... |
29.9 |
18,847 |
31.8 |
268 |
.45 |
|
6 |
Buldana ... ... ... |
394,791 |
157 |
7 |
8,410 |
8,173 |
16,583 |
2,369 |
16,583 |
11,593 |
4,000 |
15,863 |
... |
... |
95.7 |
... |
40.2 |
15,594 |
35.7 |
220 |
.50 |
|
Totals of Province... |
2,405,874 |
164 |
42 |
44,133 |
42,801 |
86,934 |
2,070 |
86,898 |
63,148 |
19,458 |
83,554 |
36 |
7 |
96.2 |
19.4 |
35.6 |
91,178 |
34.6 |
1,062 |
.43 |
|
(A.) Including dispensary vaccination.
(B.) Including deaths in dispensary towns.
B96—4
Set display mode to: Large image | Zoom image | Transcription
Images and transcriptions on this page, including medium image downloads, may be used under the Creative Commons Attribution 4.0 International Licence unless otherwise stated. ![]()
| Permanent URL | https://digital.nls.uk/91172630 |
|---|
| Attribution and copyright: |
|
|---|


