Medicine - Vaccination > 1872-1903 - Report on vaccination in the Hyderabad Assigned Districts > Vaccination Hyderabad 1872-1889 > 1884-1885 - Report on vaccination in the Hyderabad Assigned Districts, for the official year 1884-85
(322)
(323) next ›››
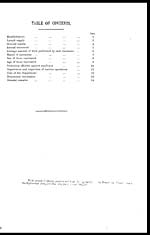
Table of contents
Download files
Individual page:
Thumbnail gallery: Grid view | List view

Set display mode to: Large image | Zoom image | Transcription
Images and transcriptions on this page, including medium image downloads, may be used under the Creative Commons Attribution 4.0 International Licence unless otherwise stated. ![]()
| Permanent URL | https://digital.nls.uk/91172411 |
|---|
| Attribution and copyright: |
|
|---|


