

Medicine - Vaccination > 1872-1903 - Report on vaccination in the Hyderabad Assigned Districts > Vaccination Hyderabad 1872-1889 > 1882-1883 - Report on vaccination in the Hyderabad Assigned Districts, for the official year 1882-83
(265) Page 4
Download files
Individual page:
Thumbnail gallery: Grid view | List view
( 4 )
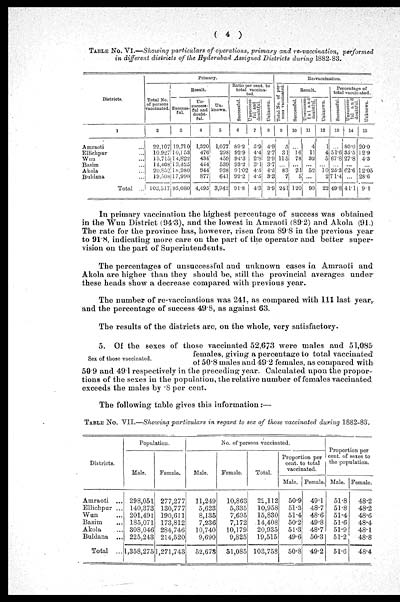
TABLE NO. VI.—Showing particulars of operations, primary and re-vaccination, performed
in different districts of the Hyderabad Assigned Districts during 1882-83.
|
Districts. |
Primary. |
Re-vaccination. |
||||||||||||
|
Total No. |
Result. |
Ratio per cent. to |
Total No. of per- |
Result. |
Percentage of |
|||||||||
|
Success- |
Un- |
Un- |
Successful. |
Unsuccess- |
Unknown. |
Successful. |
Unsuccess- |
Unknown |
Successful. |
Unsuccess- |
Unknown. |
|||
|
1 |
2 |
3 |
4 |
5 |
6 |
7 |
8 |
9 |
10 |
11 |
12 |
13 |
14 |
15 |
|
Amraoti ... |
22,107 |
19,710 |
1,320 |
1,077 |
89.2 |
5.9 |
4.9 |
5 |
... |
4 |
1 |
... |
80.0 |
20.0 |
|
Ellichpur ... |
10,927 |
10,153 |
476 |
298 |
92.9 |
4.4 |
2.7 |
31 |
16 |
11 |
4 |
51.6 |
35.5 |
12.9 |
|
Wun ... |
15,715 |
14,822 |
434 |
459 |
94.3 |
2.8 |
2.9 |
115 |
78 |
32 |
5 |
67.8 |
27.8 |
4.3 |
|
Basim ... |
14,408 |
13,425 |
444 |
539 |
93.2 |
3.1 |
3.7 |
... |
... |
... |
... |
... |
... |
... |
|
Akola ... |
20,852 |
18,980 |
944 |
928 |
91.02 |
4.5 |
4.5 |
83 |
21 |
52 |
10 |
25.3 |
62.6 |
12.05 |
|
Buldana ... |
19,508 |
17,990 |
877 |
641 |
92.2 |
4.5 |
3.3 |
7 |
5 |
... |
2 |
71.4 |
... |
28.6 |
|
Total ... |
103,517 |
95,080 |
4,495 |
3,942 |
91.8 |
4.3 |
3.9 |
241 |
120 |
99 |
22 |
49.8 |
41.1 |
9.1 |
In primary vaccination the highest percentage of success was obtained
in the Wun District (94.3), and the lowest in Amraoti (89.2) and Akola (91.)
The rate for the province has, however, risen from 89.8 in the previous year
to 91.8, indicating more care on the part of the operator and better super-
vision on the part of Superintendents.
The percentages of unsuccessful and unknown cases in Amraoti and
Akola are higher than they should be, still the provincial averages under
these heads show a decrease compared with previous year.
The number of re-vaccinations was 241, as compared with 111 last year,.
and the percentage of success 49.8, as against 63.
The results of the districts are, on the whole, very satisfactory.
Sex of those vaccinated.
5. Of the sexes of those vaccinated 52,673 were males and 51,085
females, giving a percentage to total vaccinated
of 50.8 males and 49.2 females, as compared with
50.9 and 491 respectively in the preceding year. Calculated upon the propor-
tions of the sexes in the population, the relative number of females vaccinated
exceeds the males by .8 per cent.
The following table gives this information:—
TABLE No. VII.—Showing particulars in regard to sex of those vaccinated during 1882-83.
|
Districts. |
Population. |
No. of persons vaccinated. |
Proportion per |
||||||
|
Male. |
Female. |
Male. |
Female. |
Total. |
Proportion per |
||||
|
Male. |
Female. |
Male. |
Female. |
||||||
|
Amraoti ... |
298,051 |
277,277 |
11,249 |
10,863 |
22,112 |
50.9 |
49.1 |
51.8 |
48.2 |
|
Ellichpur ... |
140,373 |
130,777 |
5,623 |
5,335 |
10,958 |
51.3 |
48.7 |
51.8 |
48.2 |
|
Wun ... |
201,491 |
190,611 |
8,135 |
7,695 |
15,830 |
51.4 |
48.6 |
51.4 |
48.6 |
|
Basim ... |
185,071 |
173,812 |
7,236 |
7,172 |
14,408 |
50.2 |
49.8 |
51.6 |
48.4 |
|
Akola ... |
308,046 |
284,746 |
10,740 |
10,179 |
20,935 |
51.3 |
48.7 |
51.9 |
48.1 |
|
Buldana ... |
225,243 |
214,520 |
9,690 |
9,825 |
19,515 |
49.6 |
50.3 |
51.2 |
48.8 |
|
Total ... |
1,358,275 |
1,271,743 |
52,673 |
51,085 |
103,758 |
50.8 |
49.2 |
51.6 |
48.4 |
Set display mode to: Large image | Zoom image | Transcription
Images and transcriptions on this page, including medium image downloads, may be used under the Creative Commons Attribution 4.0 International Licence unless otherwise stated. ![]()
| Permanent URL | https://digital.nls.uk/91172237 |
|---|
| Attribution and copyright: |
|
|---|
| Description | Covers 1872-1903. Details and appraises vaccination operations in the Hyderabad Assigned Districts. Describes manufacture and storage of lymph. Tables show particulars of vaccination. Success and mortality rates noted. Colour diagrams included. |
|---|---|
| Shelfmark | IP/20/VA.3 |
| Additional NLS resources: | |
| Description | The Vaccination collection consists of 66 volumes dating from 1856 to 1933. Reports show how vaccination against smallpox was implemented in India. They reveal the shift from variolation, improved vaccination techniques, logistics of lymph supply, funding and staffing. They explore how the local population viewed and resisted western vaccination. |
|---|---|
| Description | The India Papers collection contains publications of the central (Imperial) Government and many Indian states. Most states came under British rule. Much of the collection dates from between the post-Mutiny re-organisation of the Indian Government and Indian Independence in 1947. Some items published in London by John Murray. |
|---|---|
| Shelfmark | India Papers |
| Additional NLS resources: | |