Medicine - Vaccination > 1899-1928 - Report on vaccination in the Bombay Presidency > Vaccination in Bombay 1924-1928 > 1927-1928 - Annual notes on vaccination in the Bombay Presidency for the year 1927-28
(484) Page 44
Download files
Individual page:
Thumbnail gallery: Grid view | List view

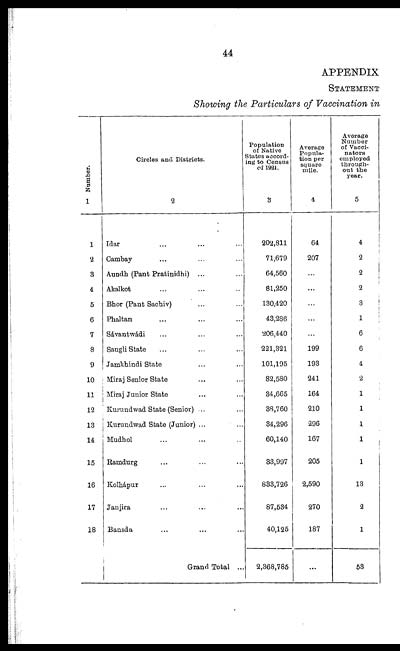
44
APPENDIX
STATEMENT
Showing the Particulars of Vaccination in
|
Number. |
Circles and Districts. |
Population |
Average |
Average |
|
1 |
2 |
3 |
4 |
5 |
|
1 |
Idar ... ... ... |
202,811 |
64 |
4 |
|
2 |
Cambay ... ... ... |
71,679 |
207 |
2 |
|
3 |
Aundh (Pant Pratinidhi) ... ... |
64,560 |
... |
2 |
|
4 |
Akalkot ... ... ... |
81,250 |
... |
2 |
|
5 |
Bhor (Pant Sachiv) ... ... ... |
130,420 |
... |
3 |
|
6 |
Phaltan ... ... ... |
43,286 |
... |
1 |
|
7 |
Sávantwádi ... ... ... |
206,440 |
... |
6 |
|
8 |
Sangli State ... ... ... |
221,321 |
199 |
6 |
|
9 |
Jamkhindi State ... ... ... |
101,195 |
193 |
4 |
|
10 |
Miraj Senior State ... ... ... |
82,580 |
241 |
2 |
|
11 |
Miraj Junior State ... ... ... |
34,665 |
164 |
1 |
|
12 |
Kurundwad State (Senior) ... ... |
38,760 |
210 |
1 |
|
13 |
Kurundwad State (Junior) ... ... |
34,296 |
296 |
1 |
|
14 |
Mudhol ... ... ... |
60,140 |
167 |
1 |
|
15 |
Ramdurg ... ... ... |
33,997 |
205 |
1 |
|
16 |
Kolhápur ... ... ... |
833,726 |
2,590 |
13 |
|
17 |
Janjira ... ... ... |
87,534 |
270 |
2 |
|
18 |
Bansda ... ... ... |
40,125 |
187 |
1 |
|
Grand Total ... |
2,368,785 |
... |
53 |
Set display mode to: Large image | Zoom image | Transcription
Images and transcriptions on this page, including medium image downloads, may be used under the Creative Commons Attribution 4.0 International Licence unless otherwise stated. ![]()
| Permanent URL | https://digital.nls.uk/91048948 |
|---|
| Attribution and copyright: |
|
|---|


