Medicine - Vaccination > 1899-1928 - Report on vaccination in the Bombay Presidency > Vaccination in Bombay 1924-1928 > 1924-1925 - Notes on vaccination in the Bombay Presidency for the year 1924-25
(171) Page 66
Download files
Individual page:
Thumbnail gallery: Grid view | List view

66
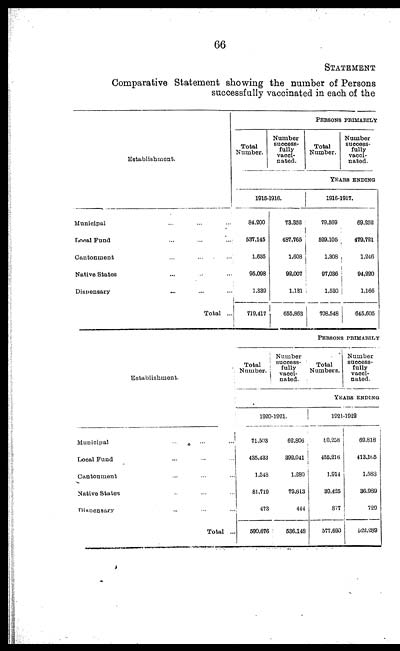
STATEMENT
Comparative Statement showing the number of Persons
successfully vaccinated in each of the
|
Establishment. |
PERSONS PRIMARILY |
|||
|
Total |
Number |
Total |
Number |
|
|
YEARS ENDING |
||||
|
1915-1916. |
1916-1917. |
|||
|
Municipal ... ... ... |
84,200 |
73,352 |
79,569 |
69,252 |
|
Local Fund ... ... ... |
537,145 |
487,765 |
529,105 |
479,721 |
|
Cantonment ... ... ... |
1,685 |
1,608 |
1,308 |
1,246 |
|
Native States ... ... ... |
95,098 |
92,007 |
97,036 |
94,220 |
|
Dispensary ... ... ... |
1,339 |
1,131 |
1,530 |
1,166 |
|
Total ... |
719,417 |
655,863 |
708,548 |
645,605 |
|
Establishment. |
PERSONS PRIMARILY |
|||
|
Total |
Number |
Total |
Number |
|
|
YEARS ENDING |
||||
|
1920-1921. |
1821-1922 |
|||
|
Municipal ... ... ... |
71,503 |
62,806 |
80,258 |
69,818 |
|
Local Fund ... ... ... |
435,433 |
392,041 |
455,216 |
413,165 |
|
Cantonment ... ... ... |
1,548 |
1,280 |
1,914 |
1,583 |
|
Native States ... ... ... |
81,719 |
79,613 |
39,425 |
36,989 |
|
Dispensary ... ... ... |
473 |
444 |
877 |
729 |
|
Total ... |
590,676 |
536,148 |
577,690 |
522,289 |
Set display mode to: Large image | Zoom image | Transcription
Images and transcriptions on this page, including medium image downloads, may be used under the Creative Commons Attribution 4.0 International Licence unless otherwise stated. ![]()
| Permanent URL | https://digital.nls.uk/91048009 |
|---|
| Attribution and copyright: |
|
|---|


