Medicine - Vaccination > 1899-1928 - Report on vaccination in the Bombay Presidency > Vaccination in Bombay 1924-1928 > 1923-1924 - Notes on vaccination in the Bombay Presidency for the year 1923-24
(58) Page 50
Download files
Individual page:
Thumbnail gallery: Grid view | List view

50
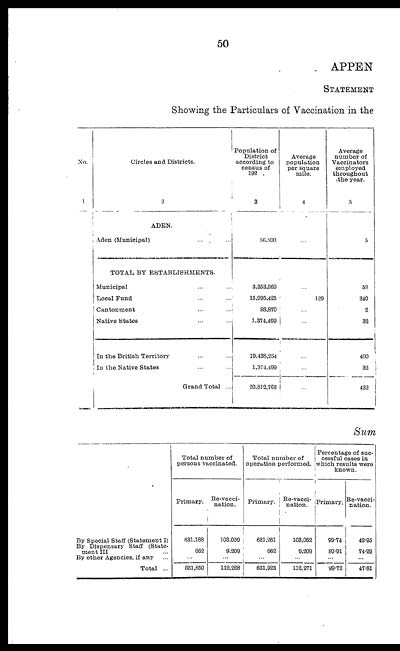
APPEN
STATEMENT
Showing the Particulars of Vaccination in the
|
No. |
Circles and Districts. |
Population of |
Average |
Average |
|
1 |
2 |
3 |
4 |
5 |
|
ADEN. |
||||
|
Aden (Municipal) ... |
56,500 |
... |
5 |
|
|
TOTAL BY ESTABLISHMENTS. |
||||
|
Municipal ... |
3,353,969 |
... |
58 |
|
|
Local Fund ... |
15,995,425 |
129 |
340 |
|
|
Cantonment ... |
88,870 |
... |
2 |
|
|
Native States ... ... |
1,374,499 |
... |
32 |
|
|
In the British Territory ... ... |
19,438,264 |
... |
400 |
|
|
In the Native States ... ... |
1,374,499 |
... |
32 |
|
|
Grand Total ... |
20,812,763 |
... |
432 |
Sum
|
Total number of |
Total number of |
Percentage of suc- |
||||
|
Primary. |
Re-vacci- |
Primary. |
Re-vacci- |
Primary. |
Re-vacci- |
|
|
By Special Staff (Statement I) |
631,188 |
103,059 |
631,261 |
103,062 |
99.74 |
42.95 |
|
By Dispensary Staff (State- |
662 |
9,209 |
662 |
9,209 |
80.91 |
74.29 |
|
By other Agencies, if any ... |
... |
... |
... |
... |
... |
... |
|
Total ... |
631,850 |
112,268 |
631,923 |
112,271 |
99.72 |
47.81 |
Set display mode to: Large image | Zoom image | Transcription
Images and transcriptions on this page, including medium image downloads, may be used under the Creative Commons Attribution 4.0 International Licence unless otherwise stated. ![]()
| Permanent URL | https://digital.nls.uk/91047668 |
|---|
| Attribution and copyright: |
|
|---|


