Medicine - Vaccination > 1899-1928 - Report on vaccination in the Bombay Presidency > Vaccination in Bombay 1913-1923 > 1918-1919 - Notes on vaccination in the Bombay Presidency for the year 1918-19 with appendices
(253) Page 24
Download files
Individual page:
Thumbnail gallery: Grid view | List view

24
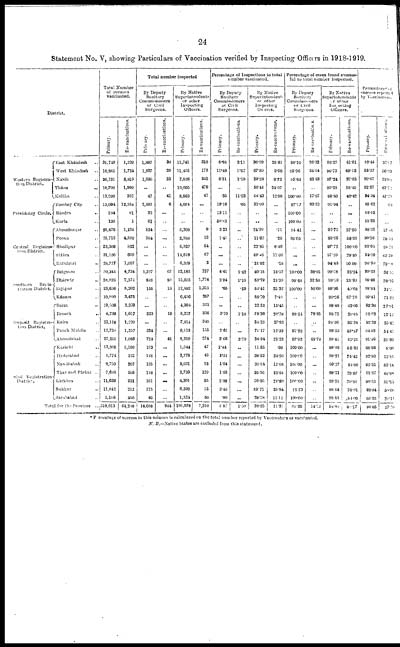
Statement No. V, showing Particulars of Vaccination verified by Inspecting Officers in 1918-1919.
|
District. |
Total Number |
Total number inspected |
Percentage of Inspections to total |
Percentage of cases found success- |
Percentages of |
||||||||||||
|
By Deputy |
By Native |
By Deputy |
By Native |
By Deputy |
By Native |
||||||||||||
|
Primary. |
Re-vaccinations. |
Primary. |
Re-vaccinations. |
Primary. |
Re-vaccinations. |
Primary. |
Re-vaccinations. |
Primary. |
Re-vaccinations. |
Primary. |
Re-vaccinations. |
Primary. |
Re-vaccinations. |
Primary. |
Re-vaccinations. |
||
|
Western Registra- |
East Khándesh .. |
31,740 |
1,220 |
1,897 |
38 |
11,741 |
310 |
5.93 |
3.11 |
36.90 |
25.41 |
98.10 |
26.32 |
98.27 |
41.61 |
80.44 |
37.17 |
|
West Khándesh .. |
16,865 |
1,734 |
1,937 |
29 |
11,435 |
173 |
11.48 |
1.67 |
67.80 |
9.98 |
85.96 |
24.14 |
96.73 |
49.13 |
35.37 |
50.33 |
|
|
Násik .. |
26,731 |
2,810 |
1,686 |
33 |
7,826 |
245 |
6.31 |
1.18 |
29.28 |
8.72 |
85.64 |
63.63 |
97.24 |
37.55 |
80.97 |
32.00 |
|
|
Thána .. |
18,790 |
1,990 |
.. |
.. |
10,605 |
479 |
... |
... |
56.44 |
24.07 |
.. |
.. |
99.28 |
58.45 |
92.37 |
67.72 |
|
|
Kolába .. |
13,290 |
362 |
47 |
41 |
8,563 |
47 |
.35 |
11.33 |
64.43 |
12.98 |
100.00 |
17.07 |
98.80 |
40.42 |
94.34 |
41.79 |
|
|
Presidency Circle. |
Bombay City .. |
15,094 |
12,764 |
2,893 |
6 |
4,694 |
... |
19.16 |
.05 |
31.09 |
... |
97.97 |
83.33 |
91.94 |
.. |
89.62 |
.04 |
|
Bándra .. |
214 |
91 |
32 |
... |
.. |
.. |
13.11 |
.. |
.. |
.. |
100.00 |
.. |
.. |
... |
68.03 |
... |
|
|
Kurla .. |
120 |
1 |
61 |
.. |
.. |
.. |
50.83 |
.. |
.. |
.. |
100.00 |
.. |
.. |
.. |
53.33 |
... |
|
|
Ceatral Registra- |
Ahmednagar .. |
25,476 |
1,124 |
824 |
... |
6,368 |
8 |
3.23 |
.. |
24.99 |
.71 |
94.41 |
... |
93.75 |
37.50 |
88.35 |
17.05 |
|
Poona .. |
25,713 |
4,590 |
364 |
... |
2,988 |
12 |
1.41 |
.. |
11.62 |
.26 |
95.05 |
... |
93.95 |
58.33 |
90.16 |
58.38 |
|
|
Sholápur .. |
23,309 |
832 |
... |
.. |
5,327 |
54 |
.. |
.. |
22.85 |
6.40 |
.. |
... |
97.72 |
100.00 |
93.64 |
98.71 |
|
|
Sátara .. |
31,196 |
609 |
... |
... |
14,616 |
67 |
... |
.. |
49.46 |
11.00 |
... |
... |
97.20 |
29.85 |
94.10 |
63.79 |
|
|
Ratnágiri .. |
28,777 |
1,097 |
... |
.. |
6,329 |
2 |
... |
.. |
21.92 |
.18 |
... |
.. |
94.45 |
50.00 |
94.50 |
75.00 |
|
|
Southern Regis- |
Belgaum .. |
30,341 |
4,734 |
1,337 |
67 |
12,183 |
737 |
4.41 |
1.42 |
40.15 |
15.57 |
100.00 |
38.82 |
99.58 |
25.24 |
99.23 |
34.51 |
|
Dhárwár .. |
28,826 |
7,274 |
848 |
80 |
15,505 |
1,774 |
2.94 |
1.10 |
53.79 |
24.39 |
99.48 |
32.50 |
99.59 |
25.99 |
98.66 |
26.16 |
|
|
Bijápur .. |
23,696 |
5,202 |
155 |
10 |
12,892 |
1,315 |
.65 |
.19 |
54.41 |
25.22 |
100.00 |
50.00 |
99.36 |
40.68 |
98.84 |
34.20 |
|
|
Kánara .. |
10,999 |
3,475 |
.. |
.. |
6,456 |
257 |
... |
.. |
58.70 |
7.40 |
.. |
.. |
99.36 |
67.70 |
99.41 |
71.22 |
|
|
Gujarát Registra- |
Surat .. |
19,508 |
2,203 |
... |
.. |
4,394 |
321 |
.. |
.. |
22.52 |
15.45 |
.. |
... |
99.48 |
42.05 |
92.36 |
27.91 |
|
Broach .. |
8,739 |
1,617 |
323 |
19 |
5,217 |
336 |
3.70 |
1.18 |
58.36 |
20.78 |
98.14 |
78.05 |
98.72 |
26.48 |
90.03 |
12.12 |
|
|
Kaira .. |
23,118 |
1,220 |
... |
.. |
7,914 |
340 |
.. |
.. |
34.23 |
27.82 |
.. |
.. |
99.36 |
36.76 |
92.32 |
35.41 |
|
|
Panch Maháls .. |
12,734 |
1,257 |
324 |
... |
9,113 |
155 |
2.61 |
... |
71.17 |
12.33 |
97.22 |
.. |
98.53 |
43.87 |
94.03 |
54.41 |
|
|
Ahmedabad .. |
27,251 |
1,083 |
724 |
41 |
8,310 |
274 |
2.66 |
3.79 |
34.94 |
25.23 |
97.93 |
48.78 |
99.41 |
45.25 |
91.46 |
31.39 |
|
|
Sind Registration |
Karáchi .. |
13,365 |
5,199 |
193 |
... |
1,544 |
47 |
1.44 |
.. |
11.55 |
.90 |
100.00 |
... |
99.48 |
55.32 |
88.66 |
8.06 |
|
Hyderabad .. |
9,774 |
123 |
148 |
... |
3,776 |
43 |
1.51 |
... |
38.53 |
31.96 |
100.00 |
... |
99.21 |
74.42 |
92.80 |
52.85 |
|
|
Nawábshah ... |
8,759 |
207 |
135 |
... |
2,631 |
25 |
1.54 |
... |
30.04 |
12.08 |
100.00 |
... |
99.77 |
84.00 |
92.31 |
53.14 |
|
|
Thar and Párkar .. |
7,686 |
588 |
143 |
... |
2,733 |
129 |
1.93 |
... |
35.56 |
21.94 |
100.00 |
.. |
99.71 |
79.07 |
91.37 |
48.98 |
|
|
Lárkána .. |
11,639 |
221 |
161 |
... |
4,301 |
55 |
1.38 |
... |
36.95 |
21.89 |
100.00 |
.. |
93.91 |
70.91 |
90.53 |
51.13 |
|
|
Sukkur .. |
11,042 |
212 |
375 |
... |
6,593 |
55 |
3.40 |
... |
69.71 |
25.94 |
99.73 |
.. |
98.64 |
70.91 |
93.94 |
50.00 |
|
|
Jacobabad .. |
5,188 |
450 |
46 |
... |
1,524 |
50 |
.89 |
... |
29.38 |
11.11 |
100.00 |
.. |
99.53 |
84.00 |
86.33 |
29.11 |
|
|
Total for the Province .. |
510,013 |
64,289 |
14,658 |
964 |
195,578 |
7,310 |
2.87 |
1.50 |
38.35 |
11.37 |
98.35 |
14.73 |
98.80 |
40.17 |
90.85 |
27.10 |
|
* Percentage of success in this column is calculated on the total number reported by Vaccinators as vaccinated.
N.B.—Native States are excluded from this statement.
Set display mode to: Large image | Zoom image | Transcription
Images and transcriptions on this page, including medium image downloads, may be used under the Creative Commons Attribution 4.0 International Licence unless otherwise stated. ![]()
| Permanent URL | https://digital.nls.uk/91035274 |
|---|
| Attribution and copyright: |
|
|---|


