Medicine - Vaccination > 1899-1928 - Report on vaccination in the Bombay Presidency > Vaccination in Bombay 1913-1923 > Notes on vaccination in the Bombay Presidency for the year 1912-1913 with appendices
(40) Page 26
Download files
Individual page:
Thumbnail gallery: Grid view | List view

26
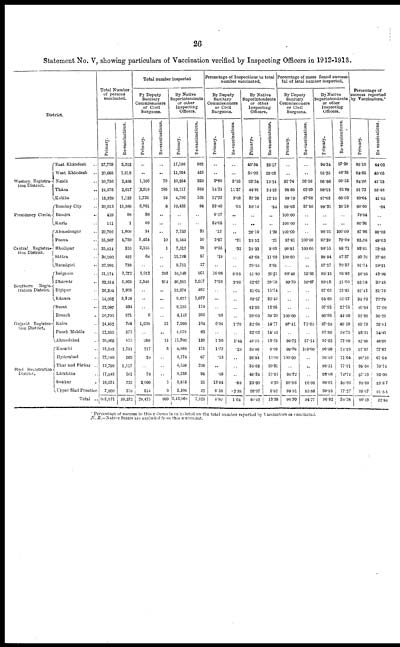
Statement No. V, showing particulars of Vaccination verified by Inspecting Officers in 1912-1913.
|
District. |
Total Number |
Total number inspected |
Percentage of Inspections to total |
Percentage of cases found success- |
Percentage of |
||||||||||||
|
By Deputy |
By Native |
By Deputy |
By Native |
By Deputy |
By Native |
||||||||||||
|
Primary. |
Re-vaccinations. |
Primary. |
Re-vaccinations. |
Primary. |
Re-vaccinations. |
Primary. |
Re-vaccinations. |
Primary. |
Re-vaccinations. |
Primary. |
Re-vaccinations. |
Primary. |
Re-vaccinations. |
Primary. |
Re-vaccinations. |
||
|
Western Registra- |
East Khándesh .. |
37,729 |
2,312 |
.. |
.. |
17,106 |
582 |
.. |
.. |
45.34 |
25.17 |
.. |
.. |
94.34 |
37.28 |
86.10 |
44.03 |
|
West Khándesh .. |
20,558 |
1,818 |
.. |
.. |
11,954 |
455 |
.. |
.. |
58.09 |
25.03 |
.. |
.. |
95.25 |
48.35 |
84.65 |
40.65 |
|
|
Násik .. |
30,756 |
2,485 |
1,106 |
79 |
10,254 |
329 |
3.60 |
3.16 |
33.34 |
13.24 |
97.74 |
26.58 |
96.86 |
56.53 |
84.56 |
41.13 |
|
|
Thána .. |
21,575 |
2,617 |
3,618 |
295 |
10,217 |
386 |
14.31 |
11.27 |
44.91 |
24.53 |
98.69 |
62.03 |
98.13 |
61.68 |
91.72 |
55.48 |
|
|
Kolába .. |
15,329 |
1,123 |
1,736 |
34 |
4,796 |
105 |
11.82 |
3.03 |
37.26 |
12.10 |
99.10 |
47.06 |
97.63 |
60.03 |
88.64 |
41.85 |
|
|
Presidency Circle. |
Bombay City .. |
20,813 |
15,580 |
6,961 |
8 |
10,435 |
84 |
33.40 |
.05 |
50.14 |
.54 |
99.63 |
37.60 |
99.31 |
26.10 |
90.60 |
.64 |
|
Bándra .. |
419 |
98 |
38 |
.. |
.. |
.. |
9.07 |
.. |
.. |
.. |
100.00 |
.. |
.. |
.. |
78.04 |
.. |
|
|
Kurla .. |
111 |
1 |
60 |
.. |
.. |
.. |
54.05 |
.. |
.. |
.. |
100.00 |
.. |
.. |
.. |
60.36 |
.. |
|
|
Central Registra- |
Ahmednagar .. |
29,702 |
1,800 |
34 |
.. |
7,753 |
25 |
.12 |
.. |
26.10 |
1.39 |
100.00 |
.. |
98.31 |
100.00 |
87.96 |
88.00 |
|
Poona .. |
35,907 |
4,750 |
1,424 |
10 |
8,444 |
10 |
3.97 |
.21 |
23.52 |
.21 |
97.61 |
100.00 |
97.29 |
70.00 |
92.08 |
49.63 |
|
|
Sholápur .. |
25,814 |
310 |
2,155 |
1 |
7,312 |
28 |
8.35 |
.32 |
23.33 |
9.03 |
99.91 |
100.00 |
99.55 |
85.71 |
93.01 |
53.55 |
|
|
Sátára .. |
36,100 |
492 |
68 |
.. |
15,769 |
57 |
.19 |
.. |
43.68 |
11.59 |
100.00 |
.. |
98.44 |
47.37 |
93.70 |
37.40 |
|
|
Ratnágiri .. |
32,995 |
738 |
.. |
.. |
9,751 |
27 |
.. |
.. |
29.65 |
3.65 |
.. |
.. |
97.27 |
70.37 |
91.74 |
59.21 |
|
|
Southern Regis- |
Belgnum |
31,174 |
3,272 |
5,012 |
293 |
10,140 |
861 |
16.08 |
8.95 |
51.80 |
26.31 |
99.40 |
15.69 |
90.15 |
26.83 |
96.85 |
43.98 |
|
Dhárwár .. |
32,314 |
6,925 |
2,346 |
204 |
20,251 |
2,057 |
7.26 |
2.95 |
62.67 |
29.70 |
99.70 |
16.67 |
99.06 |
21.00 |
95.18 |
30.48 |
|
|
Bijápur .. |
26,204 |
2,935 |
.. |
.. |
13,374 |
462 |
.. |
.. |
51.04 |
15.74 |
.. |
.. |
97.02 |
23.81 |
91.42 |
31.75 |
|
|
Kánara .. |
14,052 |
3,324 |
.. |
.. |
9,677 |
1,077 |
.. |
.. |
68.87 |
32.40 |
.. |
.. |
94.68 |
52.27 |
94.76 |
70.79 |
|
|
Gujarát Registra- |
Surat .. |
22,087 |
934 |
.. |
.. |
9,135 |
174 |
.. |
.. |
42.99 |
18.95 |
.. |
.. |
97.92 |
27.75 |
89.94 |
27.60 |
|
Broach .. |
10,706 |
671 |
6 |
.. |
4,142 |
263 |
.06 |
.. |
38.69 |
39.20 |
100.00 |
.. |
96.98 |
44.40 |
92.38 |
30.25 |
|
|
Kaira .. |
24,452 |
704 |
1,698 |
12 |
7,990 |
104 |
6.94 |
1.70 |
32.08 |
14.77 |
97.41 |
75.00 |
97.58 |
45.19 |
89.79 |
33.81 |
|
|
Panch Maháls .. |
12,555 |
570 |
.. |
.. |
4,079 |
82 |
.. |
.. |
32.02 |
14.41 |
.. |
.. |
97.89 |
38.75 |
93.31 |
34.41 |
|
|
Ahmedabad |
29,065 |
975 |
398 |
14 |
11,700 |
129 |
1.30 |
1.44 |
40.25 |
13.23 |
90.72 |
57.14 |
97.52 |
72.09 |
87.05 |
46.05 |
|
|
Sind Registration |
Karáchi .. |
12,583 |
1,751 |
217 |
5 |
4,888 |
175 |
1.72 |
.29 |
33.85 |
9.99 |
99.08 |
100.00 |
96.99 |
74.29 |
97.97 |
77.67 |
|
Hyderabad .. |
22,189 |
563 |
28 |
.. |
8,174 |
67 |
.13 |
.. |
36.84 |
11.90 |
100.00 |
.. |
98.83 |
71.64 |
98.16 |
61.58 |
|
|
Thar and Párkar .. |
12,799 |
1,117 |
.. |
.. |
4,559 |
238 |
.. |
.. |
35.62 |
20.31 |
.. |
.. |
98.51 |
77.31 |
98.04 |
70.74 |
|
|
Lárkhána .. |
17,043 |
301 |
78 |
.. |
8,238 |
95 |
.16 |
.. |
48.31 |
31.56 |
98.72 |
.. |
99.08 |
74.74 |
97.19 |
82.00 |
|
|
Sukkur .. |
16,031 |
722 |
2,090 |
5 |
3,815 |
31 |
13.04 |
.69 |
23.80 |
4.29 |
99.86 |
80.06 |
98.01 |
58.06 |
98.69 |
53.87 |
|
|
Upper Sind Frontier. |
7,809 |
378 |
514 |
9 |
2,106 |
22 |
6.58 |
2.38 |
20.97 |
5.82 |
99.91 |
55.50 |
99.95 |
77.27 |
99.07 |
91.55 |
|
|
Total .. |
601,871 |
59,272 |
29,475 |
969 |
2,42,068 |
7,925 |
4.90 |
1.64 |
40.42 |
13.38 |
98.70 |
34.77 |
96.02 |
38.28 |
90.13 |
32.84 |
|
* Percentage of success in this column is calculated on the total number reported by Vaccinators as vaccinated.
N. B.—Native States are excluded from this statement.
Set display mode to: Large image | Zoom image | Transcription
Images and transcriptions on this page, including medium image downloads, may be used under the Creative Commons Attribution 4.0 International Licence unless otherwise stated. ![]()
| Permanent URL | https://digital.nls.uk/91032908 |
|---|
| Attribution and copyright: |
|
|---|


