Medicine - Vaccination > 1899-1928 - Report on vaccination in the Bombay Presidency > Vaccination in Bombay 1902-1912 > Notes on vaccination in the Bombay Presidency for the year 1911-1912 with appendices
(483) Page 28
Download files
Individual page:
Thumbnail gallery: Grid view | List view

28
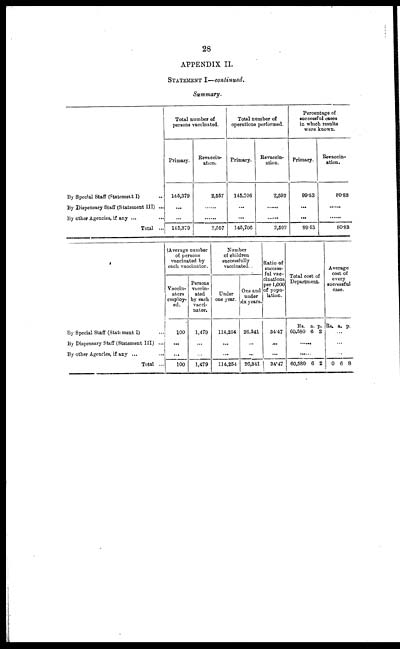
APPENDIX II.
STATEMENT I—continued.
Summary.
|
Total number of |
Total number of |
Percentage of |
||||
|
Primary. |
Revaccin- |
Primary. |
Revaccin- |
Primary. |
Revaccin- |
|
|
By Special Staff (Statement I) ... |
145,379 |
2,557 |
145,706 |
2,592 |
99.53 |
80.83 |
|
By Dispensary Staff (Statement III) ... |
... |
... |
... |
... |
... |
... |
|
By other Agencies, if any ... ... |
... |
... |
... |
... |
... |
... |
|
Total ... |
145,379 |
2,557 |
145,706 |
2,592 |
99.53 |
80.83 |
|
Average number |
Number |
Ratio of |
Total cost of |
Average |
|||||||
|
Vaccin- |
Persons |
Under |
One and |
||||||||
|
Rs. |
a. |
p. |
Rs. |
a. |
p. |
||||||
|
By Special Staff (Statement I) ... |
100 |
1,479 |
114,254 |
26,341 |
34.47 |
60,580 |
6 |
2 |
... |
||
|
By Dispensary Staff (Statement III) ... |
... |
... |
... |
... |
... |
...... |
... |
||||
|
By other Agencies, if any ... |
... |
... |
... |
... |
...... |
... |
|||||
|
Total ... |
100 |
1,479 |
114,254 |
26,341 |
34.47 |
60,580 |
6 |
2 |
0 |
6 |
8 |
Set display mode to: Large image | Zoom image | Transcription
Images and transcriptions on this page, including medium image downloads, may be used under the Creative Commons Attribution 4.0 International Licence unless otherwise stated. ![]()
| Permanent URL | https://digital.nls.uk/91032703 |
|---|
| Attribution and copyright: |
|
|---|


