

Medicine - Vaccination > 1899-1928 - Report on vaccination in the Bombay Presidency > Vaccination in Bombay 1889-1901 > 1898-1900 - Report on vaccination in the Bombay Presidency, for the year 1898-99 with appendices
(483) Page 41
Download files
Individual page:
Thumbnail gallery: Grid view | List view
41
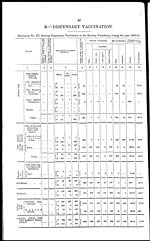
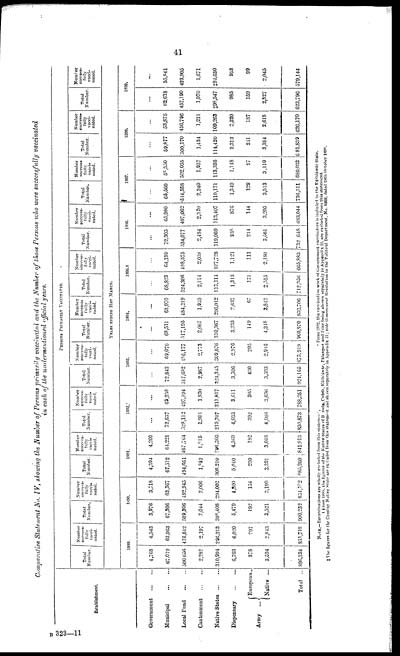
Comparative Statement No. IV, showing the Number of Persons primarily vaccinated and the Number of those Persons who were successfully vaccinated
in each of the undermentioned official years.
|
Establishment. |
PERSONS PRIMARILY VACCINATION |
||||||||||||||||||||||
|
Total |
Number |
Total |
Number |
Total |
Number |
Total |
Number |
Total |
Number |
Total |
Number |
Total |
Number |
Total |
Number |
Total |
Number |
Total |
Number |
Total |
Number |
||
|
YEARS ENDING 31ST MARCH. |
|||||||||||||||||||||||
|
1889. |
1890. |
1891. |
1892. |
1893. |
1894. |
1895.† |
1896. |
1897. |
1893. |
1899. |
|||||||||||||
|
Government ... ... |
4,768 |
4,543 |
3,976 |
3,718 |
4,394 |
4,209 |
... |
... |
... |
... |
... |
... |
... |
... |
... |
... |
... |
... |
... |
... |
... |
... |
|
|
Municipal ... ... |
67,019 |
62,963 |
67,306 |
63,367 |
67,512 |
64,221 |
72,637 |
69,258 |
72,842 |
69,076 |
68,511 |
63,970 |
68,823 |
64,130 |
72,305 |
65,980 |
65,560 |
58,350 |
59,877 |
53,875 |
62,618 |
55,841 |
|
|
Local Fund ... ... |
500,656 |
476,642 |
509,306 |
482,945 |
494,661 |
467,764 |
528,112 |
497,894 |
517,682 |
186,177 |
517,195 |
484,219 |
524,306 |
488,575 |
534,077 |
497,062 |
514,558 |
502,035 |
500,170 |
456,796 |
457,190 |
423,905 |
|
|
Cantonment ... ... |
2,282 |
2,197 |
2,044 |
2,006 |
1,852 |
1,815 |
1,901 |
1,830 |
2,967 |
2,773 |
2,067 |
1,959 |
2,114 |
2,038 |
2,484 |
2,370 |
2,240 |
1,957 |
1,434 |
1,211 |
1,970 |
1,671 |
|
|
Native States ... ... |
310,994 |
296,213 |
308,408 |
294,002 |
308,210 |
296,305 |
219,707 |
211,817 |
323,345 |
309,676 |
310,367 |
296,012 |
113,114 |
107,728 |
119,069 |
313,407 |
119,171 |
113,336 |
114,420 |
109,263 |
‡98,547 |
‡94,630 |
|
|
Dispensary ... ... |
6,703 |
6,020 |
5,479 |
4,800 |
5,010 |
4,369 |
4,033 |
3,611 |
3,306 |
2,976 |
3,233 |
2,637 |
1,313 |
1,121 |
938 |
876 |
1,340 |
1,148 |
2,313 |
2,220 |
985 |
953 |
|
|
Army ... |
European.. |
378 |
297 |
192 |
154 |
230 |
182 |
302 |
305 |
430 |
295 |
149 |
67 |
171 |
111 |
214 |
144 |
129 |
97 |
211 |
187 |
159 |
99 |
|
Native ... |
3,594 |
2,843 |
3,521 |
3,190 |
3,391 |
3,048 |
4,088 |
3,636 |
3,593 |
2,916 |
4,348 |
3,842 |
2,515 |
2,180 |
3,561 |
3,205 |
3,513 |
3,110 |
3,384 |
2,618 |
2,327 |
2,045 |
|
|
Total ... |
896,394 |
851,718 |
900,232 |
851,182 |
885,260 |
841,913 |
830,873 |
788,351 |
924,165 |
873,919 |
905,870 |
852,706 |
712,356 |
665,883 |
732,648 |
683,044 |
736,511 |
680,033 |
681,839 |
626,170 |
623,796 |
579,144 |
|
NOTE.—Revaccinations are wholly excluded from this statement, * From 1892, the vaccination work of Government vaccinators is included in the Káthiáwár State.
† From 1895, the figures of the Native States of B rods. Cutch, Káthiáwar, Pálanpur and Ídar being shown separately in Appendix II, are excluded from this statement.
‡The figures for the Cambay Native State are excluded from this statement and shown separately in Appendix II; vide Government Resolution in the Political Department, No. 5868, dated 18th October1898.
B 323—11
Set display mode to: Large image | Zoom image | Transcription
Images and transcriptions on this page, including medium image downloads, may be used under the Creative Commons Attribution 4.0 International Licence unless otherwise stated. ![]()
| Permanent URL | https://digital.nls.uk/91030900 |
|---|
| Attribution and copyright: |
|
|---|
| Description | Covers 1899-1928. Details and appraises vaccination operations in the Bombay Presidency. Tables show particulars of vaccination. Success and mortality rates noted. |
|---|---|
| Shelfmark | IP/13/VA.3 |
| Additional NLS resources: | |
| Description | The Vaccination collection consists of 66 volumes dating from 1856 to 1933. Reports show how vaccination against smallpox was implemented in India. They reveal the shift from variolation, improved vaccination techniques, logistics of lymph supply, funding and staffing. They explore how the local population viewed and resisted western vaccination. |
|---|---|
| Description | The India Papers collection contains publications of the central (Imperial) Government and many Indian states. Most states came under British rule. Much of the collection dates from between the post-Mutiny re-organisation of the Indian Government and Indian Independence in 1947. Some items published in London by John Murray. |
|---|---|
| Shelfmark | India Papers |
| Additional NLS resources: | |