

Medicine - Vaccination > 1899-1928 - Report on vaccination in the Bombay Presidency > Vaccination in Bombay 1889-1901 > 1897-1898 - Notes on vaccination in the Bombay Presidency, for the year 1897-98 with appendices
(402) Page 6
Download files
Individual page:
Thumbnail gallery: Grid view | List view
6
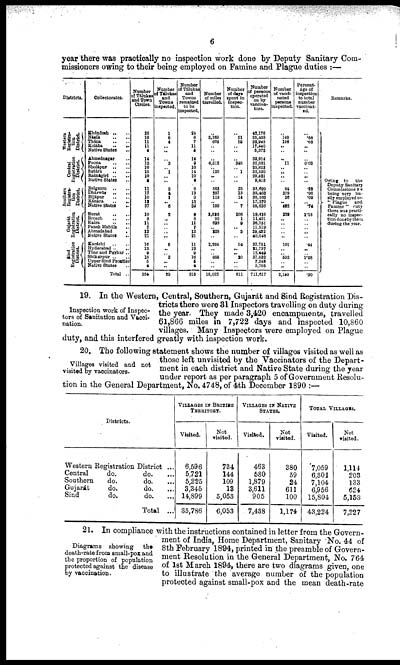
year there was practically no inspection work done by Deputy Sanitary Com-
missioners owing to their being employed on Famine and Plague duties :—
|
Districts. |
Collectorates. |
Number |
Number |
Number |
Number |
Number |
Number |
Number |
Percent- |
Remarks. |
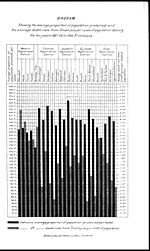
|
Western |
Khándesh .. .. |
25 |
1 |
24 |
.. |
.. |
42,176 |
.. |
.. |
Owing to the |
|
Násik .. .. |
16 |
8 |
8 |
3,169 |
51 |
25,438 |
149 |
.68 |
||
|
Thána .. .. |
11 |
4 |
7 |
604 |
58 |
22,945 |
156 |
.68 |
||
|
Kolába .. .. |
11 |
.. |
11 |
.. |
.. |
17,540 |
.. |
.. |
||
|
Native States .. |
4 |
.. |
4 |
.. |
.. |
5,375 |
.. |
.. |
||
|
Central |
Ahmednagar .. .. |
14 |
.. |
14 |
.. |
.. |
33,914 |
.. |
.. |
|
|
Poona .. .. |
12 |
3 |
9 |
6,312 |
348 |
32,631 |
11 |
0.03 |
||
|
Sholápur .. .. |
10 |
.. |
10 |
.. |
.. |
25,823 |
.. |
.. |
||
|
Sátára .. .. |
15 |
1 |
14 |
120 |
1 |
35,530 |
... |
.. |
||
|
Ratnágiri .. .. |
10 |
.. |
10 |
.. |
.. |
29,421 |
.. |
.. |
||
|
Native States .. |
4 |
.. |
4 |
.. |
.. |
9,413 |
.. |
.. |
||
|
Southern |
Belgaum .. .. |
11 |
3 |
8 |
583 |
25 |
33,699 |
84 |
.22 |
|
|
Dhárwár .. .. |
17 |
4 |
13 |
287 |
13 |
39,463 |
379 |
.06 |
||
|
Bijápur .. .. |
10 |
1 |
9 |
118 |
14 |
30,566 |
26 |
.09 |
||
|
Kánara .. .. |
19 |
.. |
13 |
.. |
.. |
17,370 |
.. |
.. |
||
|
Native States .. |
57 |
5 |
82 |
199 |
7 |
58,636 |
452 |
.74 |
||
|
Gujarát |
Surat .. .. |
10 |
2 |
8 |
2,525 |
208 |
19,416 |
229 |
1.18 |
|
|
Broach .. .. |
8 |
.. |
8 |
90 |
1 |
11,491 |
.. |
.. |
||
|
Kaira .. .. |
11 |
.. |
11 |
633 |
9 |
26,751 |
.. |
.. |
||
|
Panch Maháls .. |
7 |
.. |
7 |
.. |
.. |
11,519 |
.. |
.. |
||
|
Ahmedabad . |
12 |
.. |
12 |
228 |
2 |
29,432 |
.. |
.. |
||
|
Native States .. |
21 |
.. |
21 |
.. |
.. |
40,646 |
.. |
.. |
||
|
Sind |
Karáchi .. .. |
16 |
6 |
11 |
2,264 |
64 |
22,751 |
101 |
44 |
|
|
Hyderabad .. .. |
13 |
.. |
13 |
.. |
.. |
21,737 |
.. |
.. |
||
|
Thar and Párkar .. |
9 |
.. |
9 |
.. |
.. |
12,449 |
.. |
.. |
||
|
Shikárpur .. .. |
18 |
2 |
16 |
885 |
20 |
37,532 |
592 |
1.68 |
||
|
Upper Sind Frontier |
5 |
.. |
5 |
.. |
.. |
7,248 |
.. |
.. |
||
|
Native States .. |
6 |
.. |
4 |
.. |
.. |
5,705 |
.. |
.. |
||
|
Total .. |
354 |
39 |
316 |
18,022 |
811 |
711,617 |
2,159 |
.30 |
Inspection work of Inspec-
tors of Sanitation and Vacci-
nation.
19. In the Western, Central, Southern, Gujarát and Sind Registration Dis-
tricts there were 31 Inspectors travelling on duty during
the year. They made 3,420 encampments, travelled
61,866 miles in 7,722 days and inspected 10,860
villages. Many Inspectors were employed on Plague
duty, and this interfered greatly with inspection work.
Villages visited and not
visited by vaccinators.
20. The following statement shows the number of villages visited as well as
those left unvisited by the Vaccinators of the Depart-
ment in each district and Native State during the year
under report as per paragraph 5 of Government Resolu-
tion in the General Department, No. 4748, of 4th December 1890 :—
|
Districts. |
VILLAGES IN BRITISH |
VILLAGES IN NATIVE |
TOTAL VILLAGES |
|||
|
Visited. |
Not |
Visited. |
Not |
Visited. |
Not |
|
|
Western Registration District ... |
6,596 |
734 |
463 |
380 |
7,059 |
1,114 |
|
Central do. do. ... |
5,721 |
144 |
580 |
59 |
6,301 |
203 |
|
Southern do. do. ... |
5,225 |
109 |
1,879 |
24 |
7,104 |
133 |
|
Gujarát do. do. ... |
3,345 |
13 |
3,611 |
611 |
6,956 |
624 |
|
Sind do. do. ... |
14,899 |
5,053 |
905 |
100 |
15,804 |
5,153 |
|
Total ... |
35,786 |
6,053 |
7,438 |
1,174 |
43,224 |
7,227 |
Diagrams showing the
death-rate from small-pox and
the proportion of population
protected against the disease
by vaccination.
21. In compliance with the instructions contained in letter from the Govern-
ment of India, Home Department, Sanitary No. 44 of
8th February 1894, printed in the preamble of Govern-
ment Resolution in the General Department, No. 764
of 1st March 1894, there are two diagrams given, one
to illustrate the average number of the population
protected against small-pox and the mean death-rate
Set display mode to: Large image | Zoom image | Transcription
Images and transcriptions on this page, including medium image downloads, may be used under the Creative Commons Attribution 4.0 International Licence unless otherwise stated. ![]()
| Permanent URL | https://digital.nls.uk/91030655 |
|---|
| Attribution and copyright: |
|
|---|
| Description | Covers 1899-1928. Details and appraises vaccination operations in the Bombay Presidency. Tables show particulars of vaccination. Success and mortality rates noted. |
|---|---|
| Shelfmark | IP/13/VA.3 |
| Additional NLS resources: | |
| Description | The Vaccination collection consists of 66 volumes dating from 1856 to 1933. Reports show how vaccination against smallpox was implemented in India. They reveal the shift from variolation, improved vaccination techniques, logistics of lymph supply, funding and staffing. They explore how the local population viewed and resisted western vaccination. |
|---|---|
| Description | The India Papers collection contains publications of the central (Imperial) Government and many Indian states. Most states came under British rule. Much of the collection dates from between the post-Mutiny re-organisation of the Indian Government and Indian Independence in 1947. Some items published in London by John Murray. |
|---|---|
| Shelfmark | India Papers |
| Additional NLS resources: | |