Medicine - Vaccination > 1899-1928 - Report on vaccination in the Bombay Presidency > Vaccination in Bombay 1889-1901 > 1895-1896 - Report on vaccination in the Bombay Presidency, for the year 1895-96 with appendices
(312) Diagram
Download files
Individual page:
Thumbnail gallery: Grid view | List view

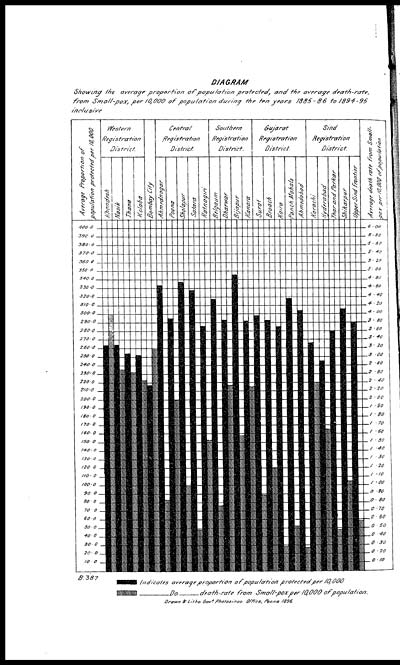
DIAGRAM
Showing the average proportion of population protected, and the average death-rate,
from Small-pox, per 10,000 of population during the ten years 1885-86 to 1894-95
inclusive
Set display mode to: Large image | Zoom image | Transcription
Images and transcriptions on this page, including medium image downloads, may be used under the Creative Commons Attribution 4.0 International Licence unless otherwise stated. ![]()
| Attribution and copyright: |
|
|---|


