

Medicine - Vaccination > 1899-1928 - Report on vaccination in the Bombay Presidency > Vaccination in Bombay 1889-1901 > 1893-1894 - Notes on vaccination in the Bombay Presidency, for the year 1893-94
(211) Page 3
Download files
Individual page:
Thumbnail gallery: Grid view | List view
3
|
No. |
Districts and Circles. |
Percentage of |
Percentage of |
||
|
1892-93. |
1893-94. |
1892-93. |
1893-94. |
||
|
1 |
Western Registration District ... ... |
94.41 |
93.70 |
41.36 |
49.59 |
|
2 |
Presidency Circle ... ... ... |
96.44 |
93.38 |
51.95 |
40.87 |
|
3 |
Central Registration District ... ... |
93.52 |
93.12 |
51.74 |
54.31 |
|
4 |
Southern do. do ... ... |
93.57 |
92.32 |
65.51 |
63.96 |
|
5 |
Gujarát do. do. ... ... |
97.81 |
97.84 |
61.24 |
66.32 |
|
6 |
Sind do. do. ... ... |
92.18 |
92.90 |
55.28 |
57.60 |
|
7 |
Aden, Bushire, Muskat, and Shaikh Othman... |
79.39 |
49.92 |
70.94 |
58.49 |
|
8 |
British Army ... ... ... |
68.61 |
44.96 |
64.60 |
38.08 |
|
9 |
Native Army ... ... ... |
81.99 |
88.24 |
52.89 |
62.86 |
|
10 |
Káthiawár Native State Circle ... ... |
94.39 |
94.32 |
63.29 |
67.87 |
|
11 |
Pálanpur do. ... ... |
97.16 |
92.41 |
90.91 |
89.74 |
|
12 |
Idar do. ... ... |
.... |
98.37 |
... |
... |
|
13 |
Baroda do. |
96.30 |
96.20 |
62.59 |
62.30 |
|
14 |
Cutch do. |
95.33 |
93.73 |
50.85 |
67.44 |
|
Average for the Presidency ... |
94.56 |
94.13 |
58.74 |
59.29 |
|
Percentage of success
excluding “ unknown “ cases.
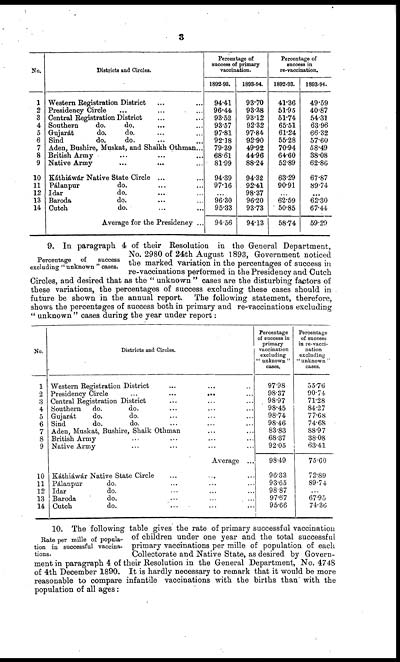
9. In paragraph 4 of their Resolution in the General Department,
No. 2980 of 24th August 1893, Government noticed
the marked variation in the percentages of success in
re-vaccinations performed in the Presidency and Cutch
Circles, and desired that as the " unknown " cases are the disturbing factors of
these variations, the percentages of success excluding these cases should in
future be shown in the annual report. The following statement, therefore,
shows the percentages of success both in primary and re-vaccinations excluding
" unknown " cases during the year under report:
|
No. |
Districts and Circles. |
Percentage |
Percentage |
|
1 |
Western Registration District ... ... ... |
97.8 |
55.76 |
|
2 |
Presidency Circle ... ... ... |
98.37 |
90.74 |
|
3 |
Central Registration District ... ... ... |
98.97 |
71.28 |
|
4 |
Southern do. do. ... ... ... |
98.45 |
84.27 |
|
5 |
Gujarát do. do. ... ... ... |
98.74 |
77.68 |
|
6 |
Sind do. do. ... ... ... |
98.46 |
74.68 |
|
7 |
Aden, Muskat, Bushire, Shaik Othman ... |
83.83 |
88.97 |
|
8 |
British Army ... ... ... ... |
68.37 |
38.08 |
|
9 |
Native Army ... ... ... ... |
92.05 |
63.41 |
|
Average ... |
98.49 |
75.60 |
|
|
10 |
Káthiáwár Native State Circle |
96.33 |
72.89 |
|
11 |
Pálanpur do. ... ... ... |
93.65 |
89.74 |
|
12 |
Idar do. ... ... ... |
98.87 |
... |
|
13 |
Baroda do. ... ... ... |
97.67 |
67.95 |
|
14 |
Cutch do. ... ... ... |
95.66 |
74.36 |
Rate per mille of popula-
tion in successful vaccina-
tions.
10. The following table gives the rate of primary successful vaccination
of children under one year and the total successful
primary vaccinations per mille of population of each
Collectorate and Native State, as desired by Govern-
ment in paragraph 4 of their Resolution in the General Department, No. 4748
of 4th December 1890. It is hardly necessary to remark that it would be more
reasonable to compare infantile vaccinations with the births than with the
population of all ages:
Set display mode to: Large image | Zoom image | Transcription
Images and transcriptions on this page, including medium image downloads, may be used under the Creative Commons Attribution 4.0 International Licence unless otherwise stated. ![]()
| Permanent URL | https://digital.nls.uk/91030084 |
|---|
| Attribution and copyright: |
|
|---|
| Description | Covers 1899-1928. Details and appraises vaccination operations in the Bombay Presidency. Tables show particulars of vaccination. Success and mortality rates noted. |
|---|---|
| Shelfmark | IP/13/VA.3 |
| Additional NLS resources: | |
| Description | The Vaccination collection consists of 66 volumes dating from 1856 to 1933. Reports show how vaccination against smallpox was implemented in India. They reveal the shift from variolation, improved vaccination techniques, logistics of lymph supply, funding and staffing. They explore how the local population viewed and resisted western vaccination. |
|---|---|
| Description | The India Papers collection contains publications of the central (Imperial) Government and many Indian states. Most states came under British rule. Much of the collection dates from between the post-Mutiny re-organisation of the Indian Government and Indian Independence in 1947. Some items published in London by John Murray. |
|---|---|
| Shelfmark | India Papers |
| Additional NLS resources: | |