Medicine - Vaccination > 1899-1928 - Report on vaccination in the Bombay Presidency > Vaccination in Bombay 1889-1901 > 1892-1893 - Report on vaccination in the Bombay Presidency, for the year 1892-93
(188) Page 10
(189) next ›››
Half title page
Download files
Individual page:
Thumbnail gallery: Grid view | List view

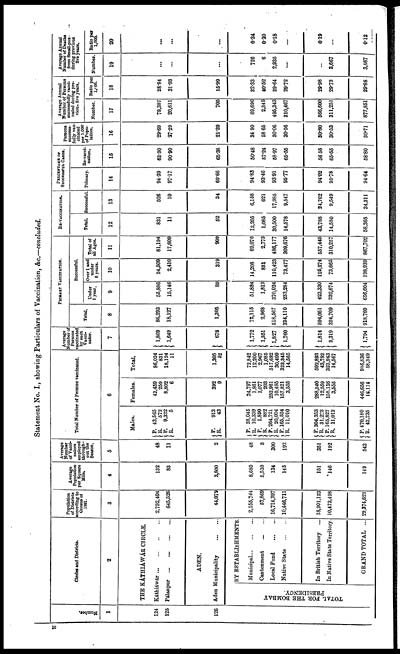
Statement No. I., showing Particulars of Vaccination, &c.—concluded.
|
Number. |
Circles and Districts. |
Population |
Average |
Average |
Total Number of Persons vaccinated. |
Average |
PRIMARY VACCINATION. |
RE-VACCINATION. |
PERCENTAGE OF |
Persons |
Average Annual |
Average Annual |
|||||||||||
|
Total. |
Successful. |
Total. |
Successful |
Primary. |
Re-vacci- |
||||||||||||||||||
|
Under |
Over 1 and |
Total of |
Number. |
Ratio per |
Number. |
Ratio per |
|||||||||||||||||
|
1 |
2 |
3 |
4 |
5 |
6 |
7 |
8 |
9 |
10 |
11 |
12 |
13 |
14 |
15 |
16 |
17 |
18 |
19 |
20 |
||||
|
Males. |
Females. |
Total. |
|||||||||||||||||||||
|
THE KÁTHIÁWÁR CIRCLE. |
|||||||||||||||||||||||
|
124 |
Káthiáwár... ... ... ... |
2,752,404 |
132 |
48 |
P. |
43,565 |
42,459 |
86,024 |
1,869 |
86,293 |
55,886 |
24,509 |
81,194 |
831 |
526 |
94.39 |
63.30 |
29.69 |
79,387 |
28.84 |
... |
... |
|
|
R. |
572 |
259 |
831 |
||||||||||||||||||||
|
125 |
Pálanpur ... ... ... ... |
645,526 |
83 |
11 |
P. |
9,322 |
8,802 |
18,124 |
1,649 |
18,127 |
15,146 |
2,410 |
17,609 |
11 |
10 |
97.17 |
90.90 |
27.29 |
20,611 |
31.93 |
... |
... |
|
|
R. |
5 |
6 |
11 |
||||||||||||||||||||
|
ADEN. |
|||||||||||||||||||||||
|
126 |
Aden Municipality ... ... |
44,079 |
3,800 |
2 |
P. |
913 |
392 |
1,305 |
678 |
1,305 |
89 |
319 |
909 |
52 |
34 |
69.66 |
65.38 |
21.39 |
705 |
15.99 |
... |
... |
|
|
R. |
43 |
9 |
52 |
||||||||||||||||||||
|
BY ESTABLISHMENTS. |
|||||||||||||||||||||||
|
TOTAL FOR THE BOMBAY |
Municipal... ... ... |
2,155,744 |
8,680 |
48 |
P. |
38,045 |
34,797 |
72,842 |
1,772 |
75,115 |
51,884 |
14,208 |
69,076 |
12,205 |
6,158 |
94.83 |
50.48 |
34.90 |
69,696 |
32.33 |
726 |
0.34 |
|
|
R. |
10,339 |
1,861 |
12,200 |
||||||||||||||||||||
|
Cantonment ... ... |
57,869 |
5,510 |
3 |
P. |
1,890 |
1,077 |
2,967 |
1,351 |
2,968 |
1,812 |
831 |
2,773 |
1,085 |
621 |
93.46 |
57.24 |
58.65 |
2,345 |
40.52 |
6 |
0.10 |
||
|
R. |
882 |
203 |
1,085 |
||||||||||||||||||||
|
Local Fund ... ... |
16,714,297 |
134 |
300 |
P. |
264,721 |
252,961 |
517,682 |
1,827 |
518,567 |
370,024 |
110,423 |
486,177 |
30,500 |
17,985 |
93.91 |
58.97 |
30.06 |
495,343 |
29.64 |
2,935 |
0.18 |
||
|
R. |
20,004 |
10,495 |
30,499 |
||||||||||||||||||||
|
Native State ... ... |
10,446,711 |
145 |
192 |
P. |
165,524 |
157,821 |
323,345 |
1,760 |
324,110 |
232,284 |
73,477 |
309,676 |
14,578 |
9,547 |
95.77 |
65.55 |
30.56 |
310,467 |
29.72 |
... |
... |
||
|
R. |
11,010 |
3,555 |
14,565 |
||||||||||||||||||||
|
In British Territory ... |
18,901,123 |
151 |
351 |
P. |
304,353 |
288,540 |
592,893 |
1,814 |
594,051 |
423,330 |
125,274 |
557,445 |
43,788 |
24,762 |
94.02 |
56.56 |
30.80 |
566,600 |
29.98 |
3 |
0.19 |
||
|
R. |
31,223 |
12,559 |
43,782 |
||||||||||||||||||||
|
In Native State Territory. |
10,473,498 |
146 |
192 |
P. |
165,827 |
158,116 |
323,943 |
2,319 |
324,709 |
232,674 |
73,665 |
310,257 |
14,580 |
9,549 |
95.78 |
65.55 |
30.53 |
311,251 |
29.72 |
3,667 |
... |
||
|
R. |
11,012 |
3,555 |
14,567 |
||||||||||||||||||||
|
GRAND TOTAL ... |
29,374,621 |
149 |
543 |
P. |
470,180 |
446,656 |
916,836 |
1,794 |
918,760 |
656,004 |
198,939 |
867,702 |
58,368 |
34,311 |
94.64 |
58.80 |
30.71 |
877,851 |
29.88 |
3,667 |
0.12 |
||
|
R. |
42,235 |
16,114 |
58,349 |
||||||||||||||||||||
10
Set display mode to: Large image | Zoom image | Transcription
Images and transcriptions on this page, including medium image downloads, may be used under the Creative Commons Attribution 4.0 International Licence unless otherwise stated. ![]()
| Permanent URL | https://digital.nls.uk/91030015 |
|---|
| Attribution and copyright: |
|
|---|


![[Page 9]](https://deriv.nls.uk/dcn4/9103/91030014.4.jpg)