Medicine - Vaccination > 1899-1928 - Report on vaccination in the Bombay Presidency > Vaccination in Bombay 1889-1901 > 1889-1890 - Report on vaccination in the Bombay Presidency, for the year 1889-90
(49) Page 1
Download files
Individual page:
Thumbnail gallery: Grid view | List view

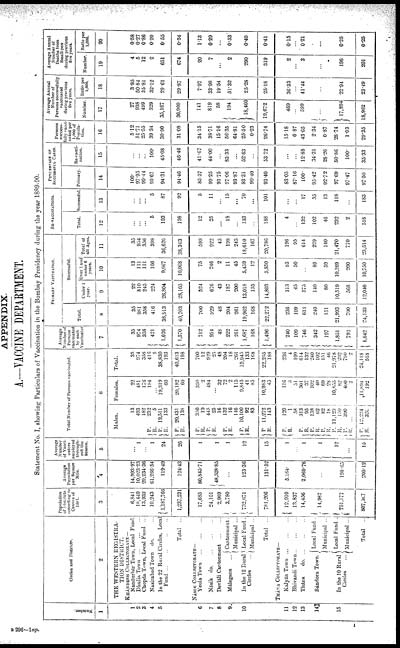
APPENDIX.
A.—VACCINE DEPARTMENT.
Statement No. I, showing Particulars of Vaccination in the Bombay Presidency during the year 1889-90.
|
Number. |
Circles and Districts. |
Population |
Average |
Average |
Total Number of Persons vaccinated. |
Average |
PRIMARY VACCINATION. |
RE-VACCINATIONS. |
PERCENTAGE OF |
Persons |
Average Annual |
Average Annual |
|||||||||||
|
Total. |
Successful. |
Total. |
Successful |
Primary. |
Re-vacci- |
||||||||||||||||||
|
Under 1 |
Over 1 and |
Total of |
Number. |
Ratio per |
Number. |
Ratio per |
|||||||||||||||||
|
1 |
2 |
3 |
4 |
5 |
6 |
7 |
8 |
9 |
10 |
11 |
12 |
13 |
14 |
15 |
16 |
17 |
18 |
19 |
20 |
||||
|
THE WESTERN REGISTRA- |
Males. |
Females. |
Total. |
||||||||||||||||||||
|
KHÁNDESH COLLECTORATE — |
|||||||||||||||||||||||
|
1 |
Nandurbár Town, Local Fund. |
6,841 |
14,993.97 |
... |
13 |
22 |
35 |
35 |
35 |
22 |
13 |
35 |
... |
... |
100. |
... |
5.12 |
27 |
3.95 |
4 |
0.58 |
||
|
2 |
Ðhulia Town ... ... ... |
18,449 |
10,023.23 |
1 |
493 |
481 |
974 |
974 |
981 |
810 |
111 |
954 |
... |
... |
97.95 |
... |
51.71 |
938 |
50.84 |
5 |
0.27 |
||
|
3 |
Chopda Town, Local Fund ... |
13,932 |
29,234.36 |
... |
182 |
176 |
358 |
358 |
358 |
245 |
111 |
356 |
... |
... |
99.44 |
... |
25.55 |
499 |
35.81 |
12 |
0.86 |
||
|
4 |
Nasirabad Town do. ... |
10,243 |
61,266.54 |
1 |
P. |
232 |
184 |
416 |
421 |
416 |
224 |
166 |
398 |
5 |
5 |
95.67 |
100. |
39.34 |
329 |
32.12 |
2 |
0.20 |
|
|
R. |
5 |
... |
5 |
||||||||||||||||||||
|
5 |
In the 22 Rural Circles, Local |
1,187,766 |
119.49 |
24 |
P. |
19,511 |
19,319 |
38,830 |
1,626 |
38,913 |
26,804 |
9,667 |
36,620 |
193 |
87 |
94.31 |
45.08 |
30.90 |
35,167 |
29.61 |
651 |
0.55 |
|
|
R. |
133 |
60 |
193 |
||||||||||||||||||||
|
Total ... |
1,237,231 |
124.43 |
26 |
P. |
20,431 |
20,182 |
40,613 |
1,570 |
40,703 |
28,105 |
10,068 |
38,363 |
198 |
92 |
94.46 |
46.46 |
31.08 |
36,960 |
29.87 |
674 |
0.54 |
||
|
R. |
138 |
60 |
198 |
||||||||||||||||||||
|
NÁSIK COLLECTORATE— |
|||||||||||||||||||||||
|
6 |
Yeola Town ... ... ... |
17,685 |
80,845.71 |
1 |
P. |
350 |
350 |
700 |
712 |
700 |
524 |
75 |
599 |
12 |
5 |
85.57 |
41.67 |
34.15 |
141 |
7.97 |
20 |
1.13 |
|
|
R. |
10 |
2 |
12 |
||||||||||||||||||||
|
7 |
Násik do. ... ... ... |
24,101 |
48,528.85 |
1 |
P. |
445 |
484 |
929 |
954 |
929 |
676 |
246 |
922 |
25 |
11 |
99.25 |
44.00 |
38.71 |
819 |
33.98 |
7 |
0.29 |
|
|
R. |
25 |
... |
25 |
||||||||||||||||||||
|
8 |
Devláli Cantonment ... ... |
2,969 |
16 |
32 |
48 |
48 |
48 |
43 |
2 |
45 |
... |
... |
93.75 |
... |
15.16 |
58 |
19.54 |
... |
... |
||||
|
9 |
Málegaon ... |
Cantonment. |
3,780 |
... |
1 |
P. |
132 |
72 |
204 |
222 |
204 |
187 |
11 |
198 |
18 |
15 |
97.06 |
83.33 |
56.35 |
194 |
51.32 |
2 |
0.53 |
|
R. |
16 |
2 |
18 |
||||||||||||||||||||
|
Municipal ... |
146 |
115 |
261 |
261 |
261 |
200 |
45 |
245 |
... |
... |
93.87 |
... |
64.81 |
||||||||||
|
10 |
In the 12 Rural |
Local Fund . |
732,671 |
123.36 |
12 |
P. |
10,100 |
9,845 |
19,945 |
1,687 |
19,962 |
13,018 |
5,459 |
18,610 |
133 |
70 |
93.31 |
52.63 |
25.50 |
18,460 |
25.28 |
290 |
0.40 |
|
R. |
92 |
41 |
133 |
||||||||||||||||||||
|
Municipal ... |
83 |
85 |
168 |
168 |
168 |
155 |
12 |
167 |
... |
... |
99.40 |
... |
0.23 |
||||||||||
|
Total ... |
781,206 |
131.52 |
15 |
P. |
11,272 |
10,983 |
22,255 |
1,496 |
22,272 |
14,803 |
5,850 |
20,786 |
188 |
101 |
93.40 |
53.72 |
26.74 |
19,672 |
25.18 |
319 |
0.41 |
||
|
R. |
143 |
45 |
188 |
||||||||||||||||||||
|
THÁNA COLLECTORATE— |
|||||||||||||||||||||||
|
11 |
Kalyán Town... ... ... |
12,910 |
5,164 |
1 |
P. |
120 |
116 |
236 |
240 |
236 |
113 |
83 |
196 |
4 |
... |
83.05 |
... |
15.18 |
469 |
36.33 |
2 |
0.15 |
|
|
R. |
1 |
3 |
4 |
||||||||||||||||||||
|
12 |
Bhivandi Town... ... ... |
13,837 |
... |
58 |
51 |
109 |
109 |
109 |
45 |
50 |
95 |
... |
... |
87.16 |
... |
6.87 |
... |
... |
... |
... |
|||
|
13 |
Thána do. ... ... ... |
14,456 |
2,069.76 |
1 |
P. |
313 |
301 |
614 |
746 |
614 |
575 |
... |
614 |
132 |
17 |
100. |
12.88 |
43.65 |
599 |
41.44 |
3 |
0.21 |
|
|
R. |
95 |
37 |
132 |
||||||||||||||||||||
|
14 |
Bándora Town. |
Local Fund . |
14,987 |
... |
1 |
P. |
138 |
102 |
240 |
342 |
240 |
140 |
89 |
229 |
102 |
35 |
95.42 |
34.31 |
2.34 |
... |
... |
... |
... |
|
R. |
62 |
40 |
102 |
||||||||||||||||||||
|
Municipal ... |
P. |
82 |
69 |
151 |
197 |
151 |
80 |
59 |
140 |
46 |
13 |
92.72 |
28.26 |
0.87 |
|||||||||
|
R. |
18 |
28 |
46 |
||||||||||||||||||||
|
15 |
In the 10 Rural |
Local Fund . |
751,177 |
198.65 |
12 |
P. |
11,123 |
10,855 |
21,978 |
1,851 |
21,993 |
10,519 |
10,269 |
21,470 |
232 |
118 |
97.69 |
50.86 |
28.74 |
17,894 |
22.94 |
196 |
0.25 |
|
R. |
150 |
82 |
232 |
||||||||||||||||||||
|
Municipal ... |
P. |
390 |
400 |
790 |
792 |
790 |
568 |
200 |
770 |
2 |
... |
97.47 |
100. |
1.03 |
|||||||||
|
... |
R. |
... |
2 |
2 |
|||||||||||||||||||
|
Total ... |
807,367 |
205.12 |
15 |
P. |
12,224 |
11,894 |
24,118 |
1,642 |
24,133 |
12,040 |
10,750 |
23,514 |
518 |
183 |
97.50 |
35.33 |
29.35 |
18,962 |
23.49 |
201 |
0.25 |
||
|
R. |
326 |
192 |
518 |
||||||||||||||||||||
B 296—1 ap.
1
Set display mode to: Large image | Zoom image | Transcription
Images and transcriptions on this page, including medium image downloads, may be used under the Creative Commons Attribution 4.0 International Licence unless otherwise stated. ![]()
| Permanent URL | https://digital.nls.uk/91029598 |
|---|
| Attribution and copyright: |
|
|---|


