

Medicine - Vaccination > 1909-1927 - Report on sanitation, dispensaries, and jails in Rajputana > Sanitation, dispensaries and jails vaccination Rajputana 1922-1927 > 1926-1927 - Annual report on the sanitation, dispensaries and jails in Rajputana for 1926 and on vaccination for the year 1926-27
(553) Page 47
Download files
Individual page:
Thumbnail gallery: Grid view | List view
AND ON VACCINATION FOR THE YEAR 1926-27. 47
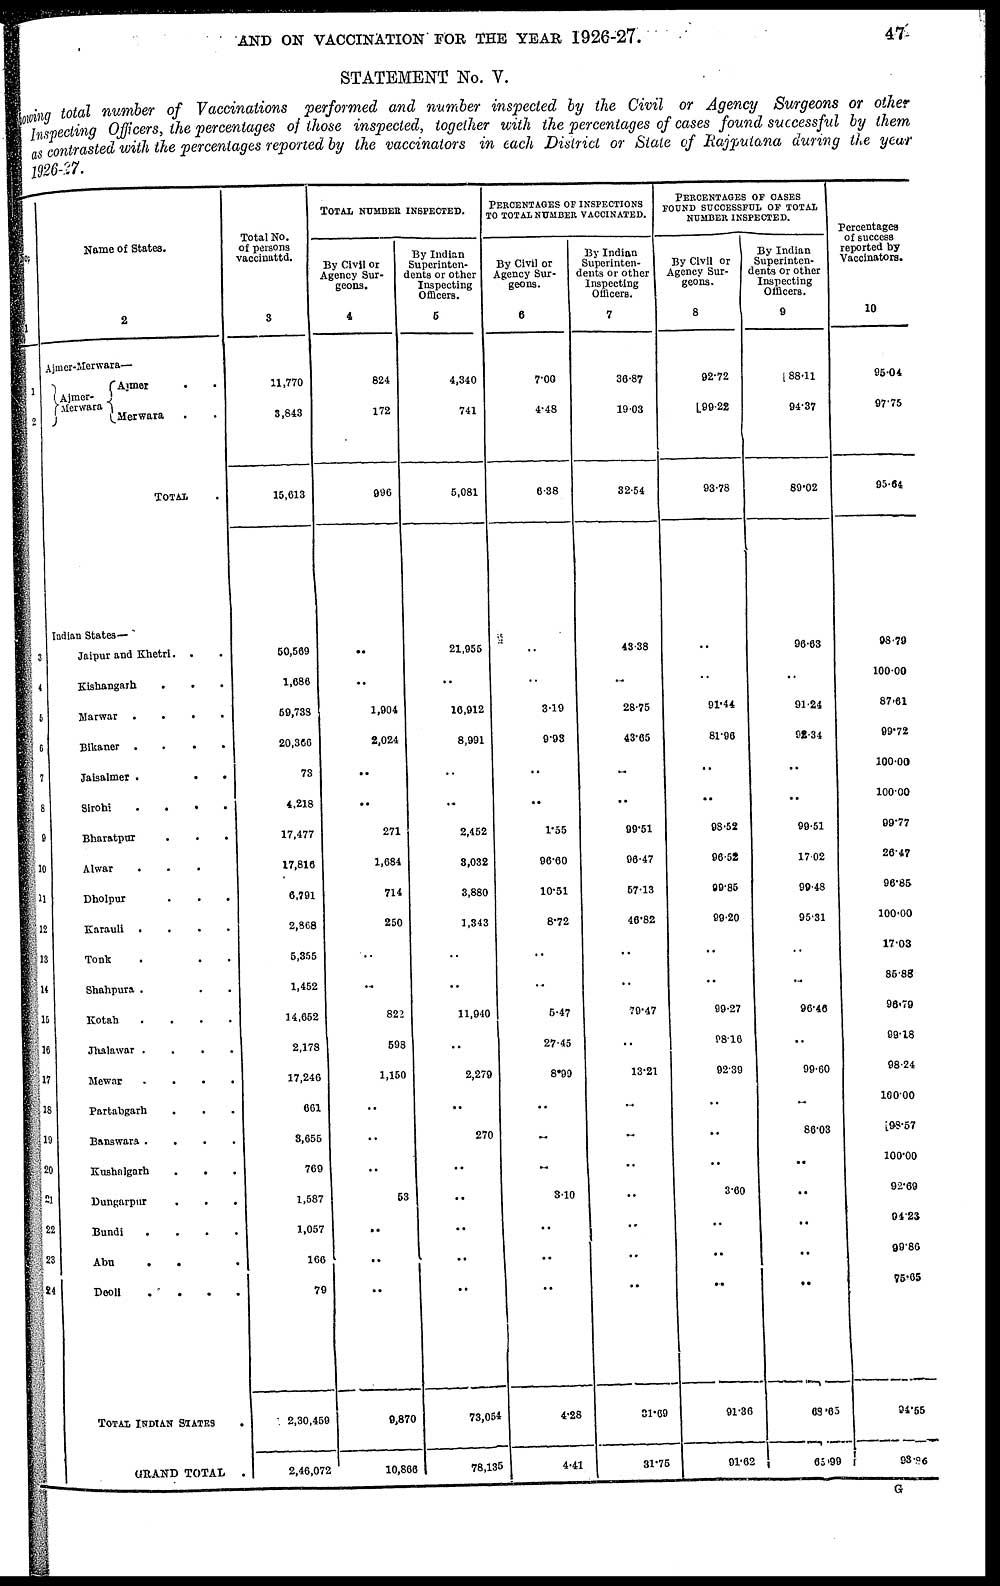
STATEMENT No. V.
Showing total number of Vaccinations performed and number inspected by the Civil or Agency Surgeons or other
Inspecting Officers, the percentages of those inspected, together with the percentages of cases found successful by them
as contrasted with the percentages reported by the vaccinators in each District or State of Rajputana during the year
1926.27.
|
No. |
Name of States. |
Total No. |
TOTAL NUMBER INSPECTED. |
PERCENTAGES OF INSPECTIONS |
PERCENTAGES OF CASES |
Percentages |
||||
|
By Civil or |
By Indian |
By Civil or |
By Indian |
By Civil or |
By Indian |
|||||
|
1 |
2 |
3 |
4 |
5 |
6 |
7 |
8 |
9 |
10 |
|
|
Ajmer.Merwara— |
||||||||||
|
1 |
Ajmer. |
Ajmer .. |
11,770 |
824 |
4,340 |
7.00 |
36.87 |
92.72 |
88.11 |
95.04 |
|
2 |
Merwara.. |
3,843 |
172 |
741 |
4.48 |
19.03 |
99.22 |
94.37 |
97.75 |
|
|
TOTAL . |
15,613 |
996 |
5,081 |
6.38 |
32.54 |
93.78 |
89.02 |
95.64 |
||
|
Indian States— |
||||||||||
|
3 |
Jaipur and Khetrl... |
50,569 |
.. |
21,955 |
.. |
43.38 |
.. |
96.63 |
98.79 |
|
|
4 |
Kishangarh ... |
1,686 |
.. |
.. |
.. |
.. |
.. |
.. |
100.00 |
|
|
6 |
Marwar .... |
59,738 |
1,904 |
16,912 |
3.19 |
28.75 |
91.44 |
91.24 |
87.61 |
|
|
6 |
Bikaner .... |
20,366 |
2,024 |
8,991 |
9.93 |
43.65 |
81.96 |
92.34 |
99.72 |
|
|
7 |
Jaisalmer .... |
73 |
.. |
.. |
.. |
.. |
.. |
.. |
100.00 |
|
|
8 |
Sirohi .... |
4,218 |
.. |
.. |
.. |
.. |
.. |
.. |
100.00 |
|
|
9 |
Bharatpur .... |
17,477 |
271 |
2,452 |
1.55 |
99.51 |
98.52 |
99.51 |
99.77 |
|
|
10 |
Alwar .... |
17,816 |
1,684 |
3,032 |
96.60 |
96.47 |
96.52 |
17.02 |
26.47 |
|
|
11 |
Dholpur .... |
6,791 |
714 |
3,880 |
10.51 |
57.13 |
99.85 |
99.48 |
96.85 |
|
|
12 |
Karauli .... |
2,868 |
250 |
1,343 |
8.72 |
46.82 |
99.20 |
95.31 |
100.00 |
|
|
13 |
Tonk .... |
5,355 |
.. |
.. |
.. |
.. |
.. |
.. |
17.03 |
|
|
14 |
Shahpura .... |
1,452 |
.. |
.. |
.. |
.. |
.. |
.. |
85.88 |
|
|
15 |
Kotah .... |
14,652 |
822 |
11,940 |
5.47 |
79.47 |
99.27 |
96.46 |
96.79 |
|
|
16 |
Jhalawar .... |
2,178 |
598 |
.. |
27.45 |
.. |
98.16 |
.. |
99.18 |
|
|
17 |
Mewar .... |
17,246 |
1,150 |
2,279 |
8.99 |
13.21 |
92.39 |
99.60 |
98.24 |
|
|
18 |
Partabgarh .... |
661 |
.. |
.. |
.. |
.. |
.. |
.. |
100.00 |
|
|
19 |
Banswara .... |
3,655 |
.. |
270 |
.. |
.. |
.. |
86.03 |
98.57 |
|
|
20 |
Kushalgarh .... |
769 |
.. |
.. |
.. |
.. |
.. |
.. |
100.00 |
|
|
21 |
Dungarpur .... |
1,587 |
53 |
.. |
3.10 |
.. |
3.60 |
.. |
92.69 |
|
|
22 |
Bundi .... |
1,057 |
.. |
.. |
.. |
.. |
.. |
.. |
94.23 |
|
|
23 |
Abu ... |
166 |
.. |
.. |
.. |
.. |
.. |
.. |
99.86 |
|
|
24 |
Deoli .... |
79 |
.. |
.. |
.. |
.. |
.. |
.. |
75.65 |
|
|
TOTAL INDIAN STATES . |
2,30,459 |
9,870 |
73,054 |
4.28 |
31.69 |
91.36 |
68.65 |
94.55 |
||
|
GRAND TOTAL . |
2,46,072 |
10,866 |
78,135 |
4.41 |
31.75 |
91.62 |
65.99 |
93.96 |
||
G
Set display mode to: Large image | Zoom image | Transcription
Images and transcriptions on this page, including medium image downloads, may be used under the Creative Commons Attribution 4.0 International Licence unless otherwise stated. ![]()
| Permanent URL | https://digital.nls.uk/91022222 |
|---|
| Attribution and copyright: |
|
|---|
| Description | Covers 1909-1927. Describes work of and provides statistics about dispensaries, hospitals, jails and vaccination programmes. Includes details on food and water supplies, medical staff and infectious disease. Some reports contain disease maps of Rajputana. |
|---|---|
| Shelfmark | IP/33/MB.3 |
| Additional NLS resources: | |
| Description | The Vaccination collection consists of 66 volumes dating from 1856 to 1933. Reports show how vaccination against smallpox was implemented in India. They reveal the shift from variolation, improved vaccination techniques, logistics of lymph supply, funding and staffing. They explore how the local population viewed and resisted western vaccination. |
|---|---|
| Description | The India Papers collection contains publications of the central (Imperial) Government and many Indian states. Most states came under British rule. Much of the collection dates from between the post-Mutiny re-organisation of the Indian Government and Indian Independence in 1947. Some items published in London by John Murray. |
|---|---|
| Shelfmark | India Papers |
| Additional NLS resources: | |