Medicine - Vaccination > 1909-1927 - Report on sanitation, dispensaries, and jails in Rajputana > Sanitation, dispensaries and jails vaccination Rajputana 1922-1927 > 1924-1925 - Annual report on the sanitation, dispensaries and jails in Rajputana for 1924 and on vaccination for the year 1924-25
(210) Page 40
Download files
Individual page:
Thumbnail gallery: Grid view | List view

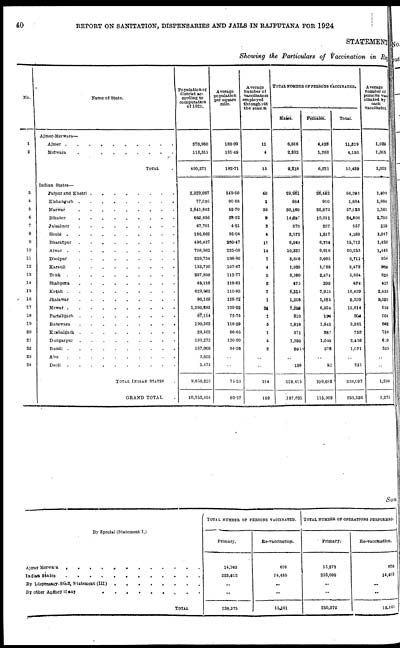
40 REPORT ON SANITATION, DISPENSARIES AND JAILS IN RAJPUTANA FOR 1924
STATEMENT
Showing the Particulars of Vaccination in Raj
|
No. |
Name of State. |
Population of |
Average |
Average |
TOTAL NUMBER OF PERSONS VACCINATED. |
Average |
||
|
Males. |
Females. |
Total. |
||||||
|
Ajmer-Merwara— |
||||||||
|
1 |
Ajmer. . . . . . . . . . |
378,960 |
183.09 |
11 |
6,886 |
4,433 |
11,819 |
1,029 |
|
2 |
Merwara . . . . . . . . |
116,311 |
181.49 |
4 |
2,332 |
1,788 |
4,120 |
1,005 |
|
TOTAL . |
495,271 |
182.71 |
15 |
9,218 |
6,221 |
15,439 |
1,029 |
|
|
Indian States— |
||||||||
|
3 |
Jaipur and Khetri . . . . . . . . |
2,329,087 |
149.50 |
40 |
29,961 |
26,432 |
56,393 |
1,409 |
|
4 |
Kishangarh . . . . . . . . . . |
77,806 |
90.68 |
1 |
984 |
900 |
1,884 |
1,884 |
|
5 |
Marwar . . . . . . . . . |
1,841,642 |
52.70 |
38 |
30,160 |
26,873 |
57,033 |
1,501 |
|
6 |
Bikaner . . . . . . . . . |
660,656 |
28.32 |
9 |
14,297 |
10,011 |
24,308 |
2,700 |
|
7 |
Jaisalmer . . . . . . . . . . |
67,701 |
4.21 |
3 |
370 |
287 |
557 |
219 |
|
8 |
Sirohi . . . . . . . . . |
186,662 |
95.04 |
4 |
2,372 |
1,817 |
4,189 |
1,047 |
|
9 |
Bharatpur . . . . . . . . . |
496,437 |
230.47 |
11 |
8,948 |
6,764 |
15,712 |
1,428 |
|
10 |
Alwar . . . . . . . . . . |
708,982 |
225.08 |
14 |
10,337 |
9,916 |
20,253 |
1,446 |
|
11 |
Dholpur . . . . . . . . |
229,734 |
198.90 |
7 |
3,646 |
3,065 |
6,711 |
958 |
|
12 |
Karauli . . . . . . . . . |
133,730 |
107.67 |
4 |
1,935 |
1,538 |
3,473 |
868 |
|
13 |
Tonk . . . . . . . . . |
287,898 |
112.77 |
9 |
3,190 |
2,474 |
5,664 |
629 |
|
14 |
Shahpura . . . . . . . . . |
48,118 |
118.81 |
2 |
475 |
399 |
874 |
437 |
|
15 |
Kotah . . . . . . . . . |
629,962 |
110.83 |
7 |
8,514 |
7,925 |
16,439 |
2,435 |
|
16 |
Jhalawar . . . . . . . . . |
96,168 |
118.72 |
1 |
1,205 |
1,125 |
2,330 |
2,330 |
|
17 |
Mewar . . . . . . . . . |
1,393,283 |
109.22 |
24 |
7,299 |
6,524 |
13,814 |
658 |
|
18 |
Parthbgarh . . . . . . . . . . . . |
67,114 |
75.75 |
1 |
310 |
194 |
504 |
504 |
|
19 |
Banswara . . . . . . . . . . |
190,362 |
118.59 |
5 |
1,818 |
1,543 |
3,361 |
652 |
|
20 |
Kushalgarh . . . . . . . . .. |
29,462 |
86.65 |
1 |
371 |
387 |
758 |
758 |
|
21 |
Dungarpur . . . . . . . . . . . . . |
189,272 |
130.80 |
4 |
1,398 |
1,040 |
2,438 |
610 |
|
22 |
Bundi . . . . . . . . . . . |
187,068 |
84.26 |
2 |
695 |
376 |
1,071 |
535 |
|
23 |
Abu . . . . . . . . . |
3,605 |
.. |
.. |
.. |
.. |
.. |
.. |
|
24 |
Deoli . . . . . . . . . |
3,474 |
.. |
.. |
139 |
92 |
231 |
.. |
|
TOTAL INDIAN STATES . |
9,858,223 |
75.23 |
184 |
128,415 |
100,682 |
238,097 |
1,294 |
|
|
GRAND TOTAL . |
10,353,494 |
80.27 |
199 |
137,633 |
115,903 |
253,536 |
1,275 |
|
Sum
|
By Special (Statement I.) |
TOTAL NUMBER OF PERSONS VACCINATED. |
TOTAL NUMBER OF OPERATIONS PERFORMED. |
||
|
Primary. |
Re-vaccination. |
Primary. |
Re-vaccination. |
|
|
Ajmer Merwara . . . . . . . . . . . . |
14,763 |
676 |
15,273 |
676 |
|
Indian States . . . . . . . . . . . . . . |
223,612 |
14,485 |
235,099 |
14,485 |
|
By Dispensary Staff, Statement(III) . . . . . . . . |
.. |
.. |
.. |
.. |
|
By other Agency if any . . . . . . . . . . . |
.. |
.. |
.. |
.. |
|
TOTAL |
238,375 |
15,161 |
250,372 |
15,161 |
Set display mode to: Large image | Zoom image | Transcription
Images and transcriptions on this page, including medium image downloads, may be used under the Creative Commons Attribution 4.0 International Licence unless otherwise stated. ![]()
| Permanent URL | https://digital.nls.uk/91021193 |
|---|
| Attribution and copyright: |
|
|---|


