Medicine - Vaccination > 1909-1927 - Report on sanitation, dispensaries, and jails in Rajputana > Report on sanitation, dispensaries, and jails in Rajputana for 1909, and on vaccination for the year 1909-1910 > Report on sanitation, dispensaries, and jails in Rajputana for 1909, and on vaccination for the year 1909-1910
(52) Page 41
Download files
Individual page:
Thumbnail gallery: Grid view | List view

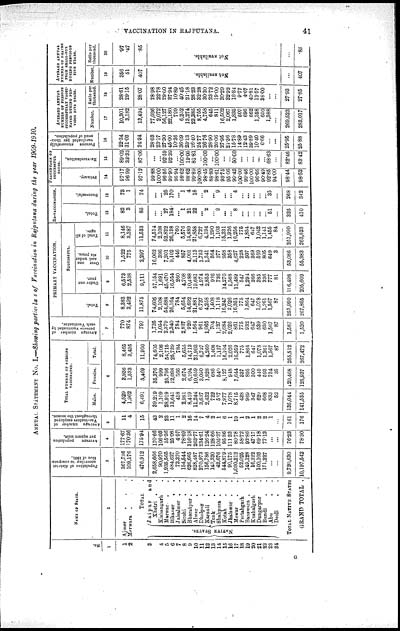
VACCINATION IN RAJPUTANA. 41
ANNUAL STATEMENT No. I.—Showing particulas of Vaccination in Rajputana during the year 1909-1910.
|
No |
NAME OF STATE. |
Population of district |
Average population |
Average number of |
TOTAL NUMBER OF PERSONS |
Average number of |
PRIMARY VACCINATION. |
RE-VACCINATION. |
PERCENTAGE OF |
Persons successfully |
AVERAGE ANNUAL |
AVERAGE ANNUAL |
||||||||||
|
Total. |
SUCCESSFUL. |
Total. |
Successful. |
Primary. |
Re-vaccination. |
|||||||||||||||||
|
Under one |
Over one |
Total of all |
||||||||||||||||||||
|
Males. |
Females. |
Total. |
Number. |
Ratio per |
Number. |
Ratio per |
||||||||||||||||
|
1 |
2 |
3 |
4 |
5 |
6 |
7 |
8 |
9 |
10 |
11 |
12 |
13 |
14 |
15 |
16 |
17 |
18 |
19 |
20 |
|||
|
1 |
Ajmer . . . |
367,736 |
177.67 |
11 |
4,529 |
3,936 |
8,465 |
770 |
8,383 |
6,573 |
1,522 |
8,146 |
82 |
73 |
97.17 |
89.02 |
22.34 |
10,301 |
28.61 |
356 |
.97 |
|
|
2 |
Merwara . . |
109,176 |
170.36 |
4 |
1,962 |
1,533 |
3,495 |
874 |
3,492 |
2,538 |
775 |
3,387 |
3 |
1 |
96.99 |
33.33 |
31.03 |
3,182 |
29.15 |
51 |
.47 |
|
|
TOTAL . |
476,912 |
175.94 |
15 |
6,491 |
5,469 |
11,960 |
797 |
11,875 |
9,111 |
2,297 |
11,533 |
85 |
74 |
97.12 |
87.06 |
24.34 |
13,494 |
28.07 |
407 |
.85 |
||
|
3 |
NATIVE STATES. |
Jaipur and |
2,658,666 |
170.66 |
43 |
39,229 |
35,376 |
74,605 |
1,735 |
74,605 |
57,154 |
16,062 |
74,514 |
... |
... |
99.88 |
... |
28.03 |
77,036 |
28.98 |
||
|
4 |
Kishangarh . |
90,970 |
106.03 |
2 |
1,109 |
999 |
2,108 |
1,054 |
2,108 |
1,691 |
396 |
2,108 |
... |
... |
100.00 |
... |
23.17 |
2,072 |
22.78 |
Not available. |
Not available. |
|
|
5 |
Marwar . . |
1,935,565 |
55.36 |
23 |
28,919 |
25,796 |
54,715 |
2,379 |
54,688 |
45,470 |
7,201 |
52,822 |
27 |
25 |
96.56 |
92.59 |
27.30 |
56,127 |
29.00 |
|||
|
6 |
Bikaner . . |
584,627 |
25.08 |
11 |
13,641 |
12,098 |
25,739 |
2,340 |
26,164 |
16,554 |
9,102 |
26,138 |
184 |
170 |
99.90 |
92.39 |
45.00 |
22,180 |
37.94 |
|||
|
7 |
Jaisalmer . . |
73,370 |
4.57 |
1 |
418 |
366 |
784 |
784 |
784 |
260 |
446 |
760 |
... |
... |
96.94 |
... |
10.36 |
799 |
10.89 |
|||
|
8 |
Sirohi . . |
154,544 |
78.69 |
2 |
2,981 |
2,674 |
5,655 |
2,827 |
5,654 |
4,708 |
857 |
5,576 |
1 |
1 |
98.62 |
100.00 |
36.09 |
6,252 |
40.45 |
|||
|
9 |
Bharatpur . . |
626,665 |
316.18 |
16 |
8,419 |
6,294 |
14,713 |
920 |
14,692 |
10,488 |
4,001 |
14,489 |
21 |
4 |
98.62 |
19.05 |
23.13 |
13,274 |
21.18 |
|||
|
10 |
Alwar . . |
828,487 |
263.77 |
14 |
11,244 |
10,659 |
21,903 |
1,564 |
21,881 |
19,681 |
2,113 |
21,858 |
22 |
18 |
99.89 |
81.81 |
26.40 |
23,385 |
28.23 |
|||
|
11 |
Dholpur . . |
270,973 |
234.61 |
7 |
3,637 |
3,090 |
6,727 |
961 |
6,727 |
4,974 |
1,753 |
6,727 |
... |
... |
100.00 |
... |
24.77 |
8,755 |
32.28 |
|||
|
12 |
Karauli . . |
156,786 |
126.24 |
4 |
2,432 |
1,828 |
4,260 |
1,065 |
4,258 |
2,853 |
1,341 |
4,194 |
2 |
2 |
98.45 |
100.00 |
26.76 |
4,758 |
30.30 |
|||
|
13 |
Tonk . . |
143,330 |
128.66 |
2 |
722 |
686 |
1,408 |
704 |
1,408 |
926 |
364 |
1,290 |
... |
... |
88.80 |
... |
28.90 |
645 |
23.72 |
|||
|
14 |
Shahpura . . |
42,676 |
105.37 |
1 |
587 |
540 |
1,127 |
1,127 |
1,118 |
726 |
377 |
1,103 |
9 |
9 |
98.61 |
100.00 |
26.06 |
811 |
19. 00 |
|||
|
15 |
Kotah . . |
544,879 |
95.86 |
6 |
7,977 |
8,127 |
16,104 |
2,684 |
16,247 |
14,270 |
958 |
15,231 |
... |
... |
93.75 |
... |
27.95 |
16,502 |
30.29 |
|||
|
16 |
Jhalawar . . |
90,175 |
111.33 |
1 |
1,078 |
948 |
2,026 |
2,026 |
2,026 |
1,568 |
358 |
1,926 |
... |
... |
95.06 |
... |
21.36 |
2,067 |
22.92 |
|||
|
17 |
Mewar . . |
1,030,212 |
80.78 |
19 |
8,715 |
7,644 |
16,359 |
861 |
16,351 |
11,489 |
4,627 |
16,256 |
8 |
4 |
99.42 |
50.00 |
15.78 |
1,835 |
16.84 |
|||
|
18 |
Pertabgarh . |
52,025 |
58.72 |
1 |
438 |
337 |
775 |
775 |
775 |
547 |
228 |
775 |
... |
... |
100.00 |
... |
14.89 |
507 |
9.77 |
|||
|
19 |
Banswara . . |
149,128 |
92.86 |
2 |
969 |
895 |
1,864 |
932 |
1,864 |
1,294 |
507 |
1,854 |
... |
... |
99.46 |
... |
12.43 |
696 |
4.67 |
|||
|
20 |
Kushalgarh . |
16,222 |
47.17 |
1 |
347 |
300 |
647 |
647 |
647 |
266 |
369 |
647 |
... |
... |
100.00 |
... |
39.89 |
662 |
40.81 |
|||
|
21 |
Dungarpur . |
100,103 |
69.18 |
2 |
629 |
449 |
1,078 |
539 |
1,078 |
385 |
569 |
1,042 |
... |
... |
96.66 |
... |
10.40 |
1,358 |
13.57 |
|||
|
22 |
Bundi . . |
171,227 |
77.13 |
2 |
668 |
593 |
1,261 |
630 |
1,261 |
336 |
805 |
1,141 |
... |
... |
90.49 |
... |
6.66 |
650 |
38.00 |
|||
|
23 |
Abu . . |
... |
... |
1 |
833 |
734 |
1,567 |
l,567 |
1,567 |
777 |
649 |
1,455 |
51 |
35 |
92.85 |
68.63 |
... |
1,388 |
... |
|||
|
24 |
Deoli . . |
... |
... |
... |
52 |
35 |
87 |
87 |
87 |
81 |
3 |
84 |
... |
... |
94.00 |
... |
... |
... |
... |
|||
|
TOTAL NATIVE STATES |
9,720,630 |
76.23 |
161 |
135,044 |
120,468 |
255,512 |
1,587 |
255,990 |
196,498 |
53,086 |
251,990 |
325 |
268 |
98.44 |
82.46 |
25.95 |
269,523 |
27.93 |
... |
|||
|
GRAND TOTAL . |
10,197,542 |
78.30 |
176 |
141,535 |
125,937 |
267,472 |
1,520 |
267,865 |
205,609 |
55,383 |
263,523 |
410 |
342 |
98.52 |
83.42 |
25.88 |
283,017 |
27.85 |
407 |
.85 |
||
Set display mode to: Large image | Zoom image | Transcription
Images and transcriptions on this page, including medium image downloads, may be used under the Creative Commons Attribution 4.0 International Licence unless otherwise stated. ![]()
| Permanent URL | https://digital.nls.uk/90721841 |
|---|


