Medicine - Vaccination > 1904-1928 - Report on vaccination in the North-West Frontier Province > Notes on vaccination in the North-West Frontier Province 1923-1928 > 1922-1923 - Notes on vaccination in the North-West Frontier Province for the year 1922-23
(36) Page xiii
Download files
Individual page:
Thumbnail gallery: Grid view | List view

( xiii )
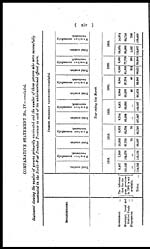
COMPARATIVE STATEMENT No. IV.
Statement showing the number of persons primarily vaccinated and the number of those persons who were successfully
vaccinated in the North-West Frontier Province in each of the undermentioned official years.
|
ESTABLISHMENT. |
PERSONS PRIMARILY VACCINATED. |
||||||||||||
|
Total number. |
Number successfully |
Total number. |
Number successfully |
Total number. |
Number successfully |
Total number. |
Number successfully |
Total number. |
Number successfully |
Total number. |
Number successfully |
||
|
Year ending 31st March. |
|||||||||||||
|
From 1900 to |
1913. |
1914. |
1915. |
1916. |
1917. |
||||||||
|
Government ... |
The informa- |
118,703 |
107,106 |
10,125 |
9,718 |
11,353 |
10,831 |
7,341 |
6,548 |
10,140 |
9,450 |
6,601 |
5,953 |
|
Municipal, Local and |
965,502 |
914,890 |
113,385 |
110,276 |
131,922 |
129,207 |
130,866 |
128,616 |
112,546 |
110,489 |
126,421 |
122,423 |
|
|
Dispensaries ... |
8,434 |
6,194 |
299 |
291 |
108 |
94 |
8 |
7 |
... |
... |
... |
... |
|
|
TOTAL ... |
1,092,639 |
1,028,190 |
123,809 |
120,285 |
143,383 |
140,132 |
138,215 |
135,171 |
122,686 |
119,939 |
133,022 |
128,376 |
|
Set display mode to: Large image | Zoom image | Transcription
Images and transcriptions on this page, including medium image downloads, may be used under the Creative Commons Attribution 4.0 International Licence unless otherwise stated. ![]()
| Permanent URL | https://digital.nls.uk/90720390 |
|---|
| Attribution and copyright: |
|
|---|


