

Medicine - Vaccination > 1904-1928 - Report on vaccination in the North-West Frontier Province > Notes on vaccination in the North-West Frontier Province 1923-1928 > 1922-1923 - Notes on vaccination in the North-West Frontier Province for the year 1922-23
(32) Page ix
Download files
Individual page:
Thumbnail gallery: Grid view | List view
( ix )
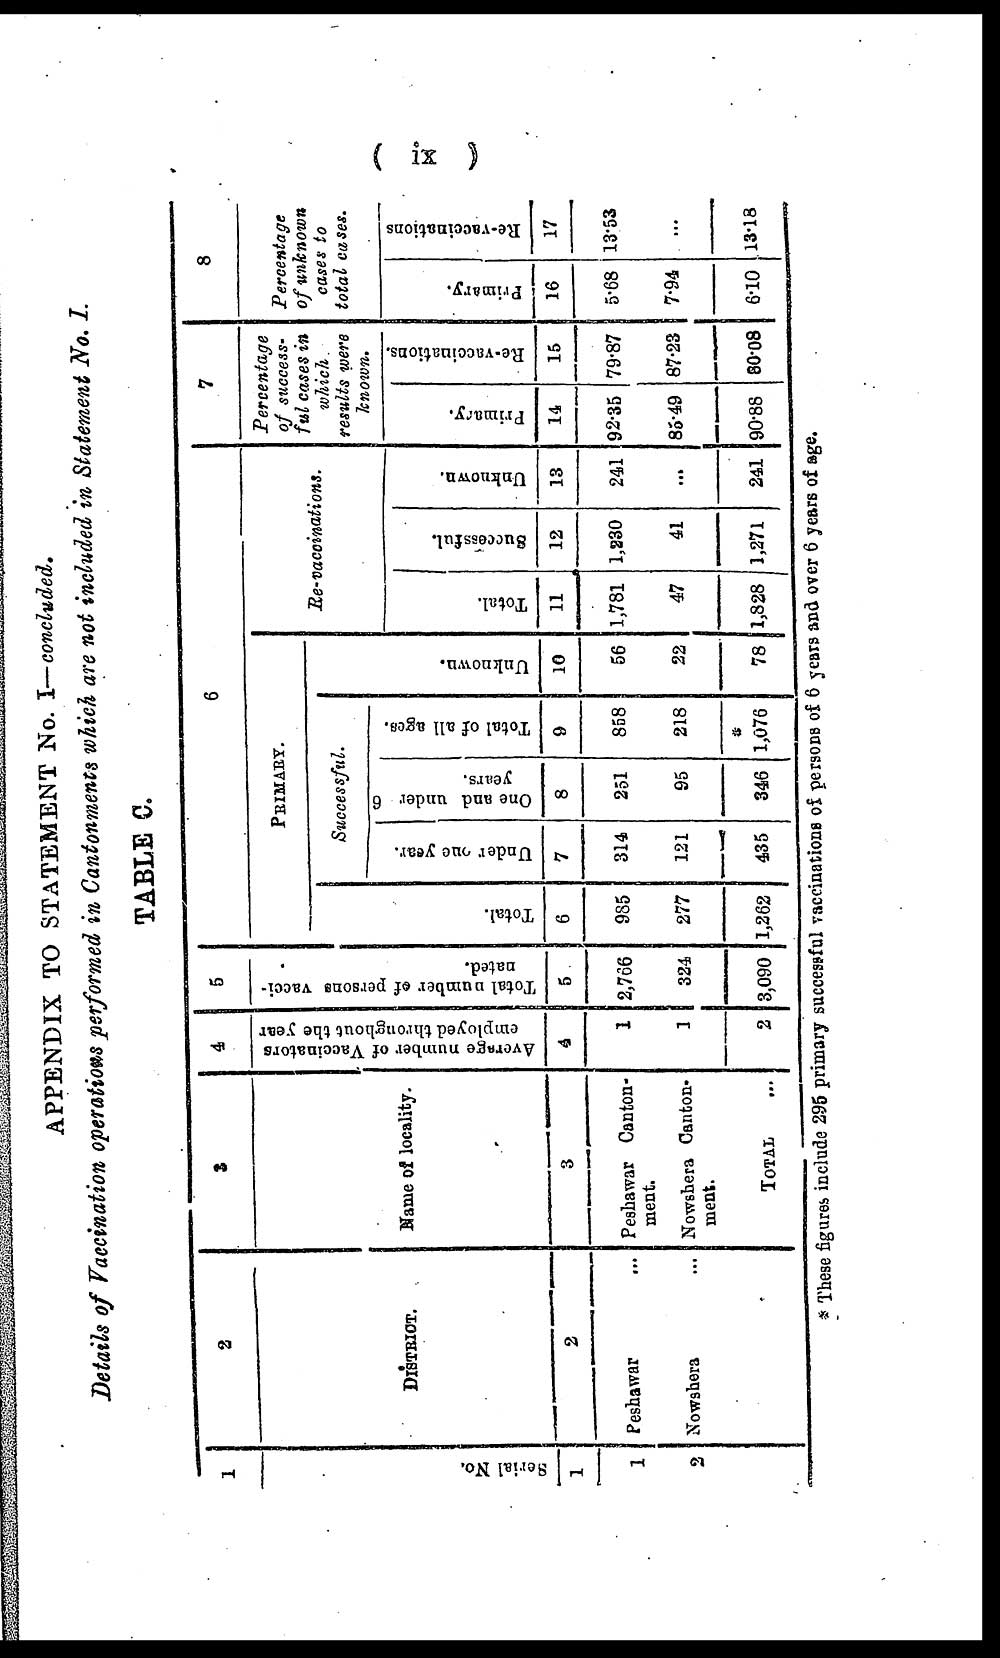
APPENDIX TO STATEMENT No. I— concluded.
Details of Vaccination operations performed in Cantonments which are not included in Statement No. I.
TABLE C.
|
1 |
2 |
3 |
4 |
5 |
6 |
7 |
8 |
|||||||||
|
Serial No. |
DISTRICT. |
Name of locality. |
Average number of Vaccinators |
Total number of persons vacci- |
PRIMARY. |
Re-vaccinations. |
Percentage |
Percentage |
||||||||
|
Total. |
Successful. |
Unknown. |
||||||||||||||
|
Under one year. |
One and under 6 |
Total of all ages. |
||||||||||||||
|
Total. |
Successful. |
Unknown. |
Primary. |
Re-vaccinations. |
Primary. |
Re-vaccinations |
||||||||||
|
1 |
2 |
3 |
4 |
5 |
6 |
7 |
8 |
9 |
10 |
11 |
12 |
13 |
14 |
15 |
16 |
17 |
|
1 |
Peshawar ... |
Peshawar Canton- |
1 |
2,766 |
985 |
314 |
251 |
858 |
56 |
1,781 |
1,230 |
241 |
92.35 |
79.87 |
5.68 |
13.53 |
|
2 |
Nowshera ... |
Nowshera Canton- |
1 |
324 |
277 |
121 |
95 |
218 |
22 |
47 |
41 |
... |
85.49 |
87.23 |
7.94 |
... |
|
TOTAL ... |
2 |
3,090 |
1,262 |
435 |
346 |
* |
78 |
1,828 |
1,271 |
241 |
90.88 |
80.08 |
6.10 |
13.13 |
||
* These figures include 295 primary successful vaccinations of persons of 6 yesrs and over 6 years of age.
Set display mode to: Large image | Zoom image | Transcription
Images and transcriptions on this page, including medium image downloads, may be used under the Creative Commons Attribution 4.0 International Licence unless otherwise stated. ![]()
| Permanent URL | https://digital.nls.uk/90720378 |
|---|
| Attribution and copyright: |
|
|---|
| Description | Covers 1904-1928. Details and appraises vaccination operations in the North-West Frontier Province. Describes manufacture and storage of lymph. Tables show particulars of vaccination. Success and mortality rates noted. Colour diagrams included. |
|---|---|
| Shelfmark | IP/29/VA.3 |
| Additional NLS resources: | |
| Description | The Vaccination collection consists of 66 volumes dating from 1856 to 1933. Reports show how vaccination against smallpox was implemented in India. They reveal the shift from variolation, improved vaccination techniques, logistics of lymph supply, funding and staffing. They explore how the local population viewed and resisted western vaccination. |
|---|---|
| Description | The India Papers collection contains publications of the central (Imperial) Government and many Indian states. Most states came under British rule. Much of the collection dates from between the post-Mutiny re-organisation of the Indian Government and Indian Independence in 1947. Some items published in London by John Murray. |
|---|---|
| Shelfmark | India Papers |
| Additional NLS resources: | |